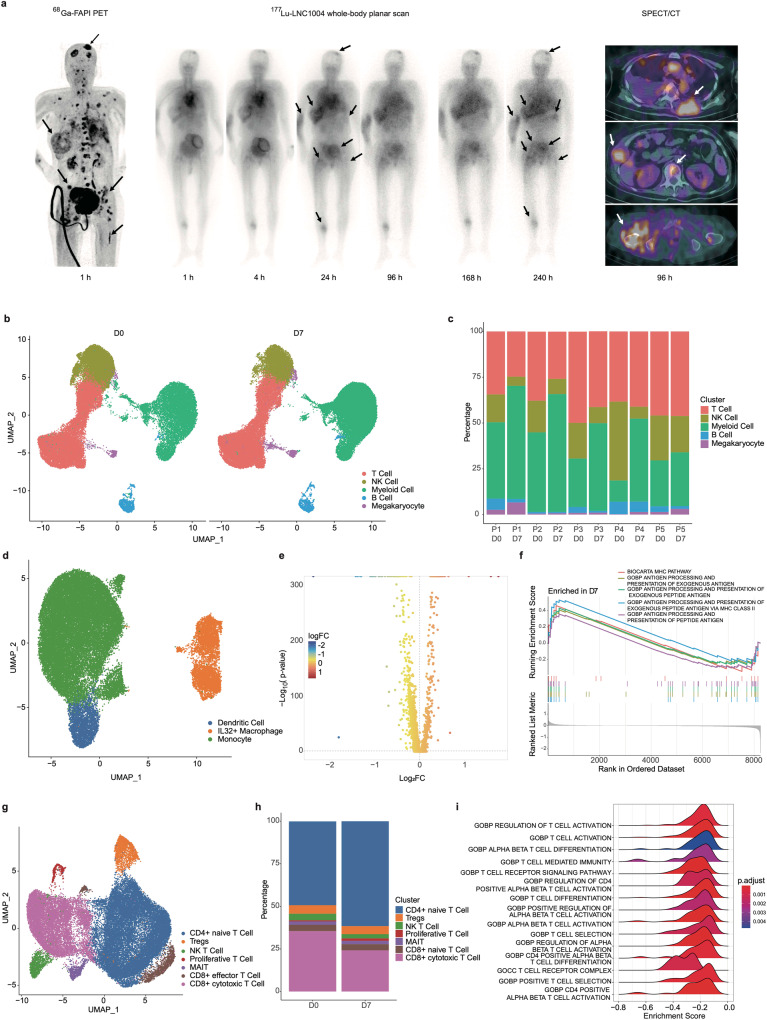
Fig. 7.
Single-cell RNA sequencing (scRNA-seq) of peripheral blood mononuclear cells (PBMCs) before and after treatment. a Representative images from PET, serial whole-body planar scan, and SPECT/CT scans of a patient (metastatic breast cancer) who received 177Lu-LNC1004 therapy. b UMAP plot of all cells color-coded according to their major cell types based on canonical markers. c Bar charts display the distribution of the principal cellular lineages in individual patients pre- and posttreatment. d UMAP plot showing the subpopulations of myeloid cells prior to and after treatment. e Volcano plots of differentially expressed genes within myeloid cells pre- and posttreatment. f Gene Set Enrichment Analysis (GSEA) of differentially expressed genes between pre- and posttreatment. g UMAP plot showing T-cell subpopulations pre- and posttreatment. h Bar charts showing variations in the proportion of T-cell subtypes across patients pre- and posttreatment. i GSEA of differentially expressed genes within T-cells pre- and posttreatment

