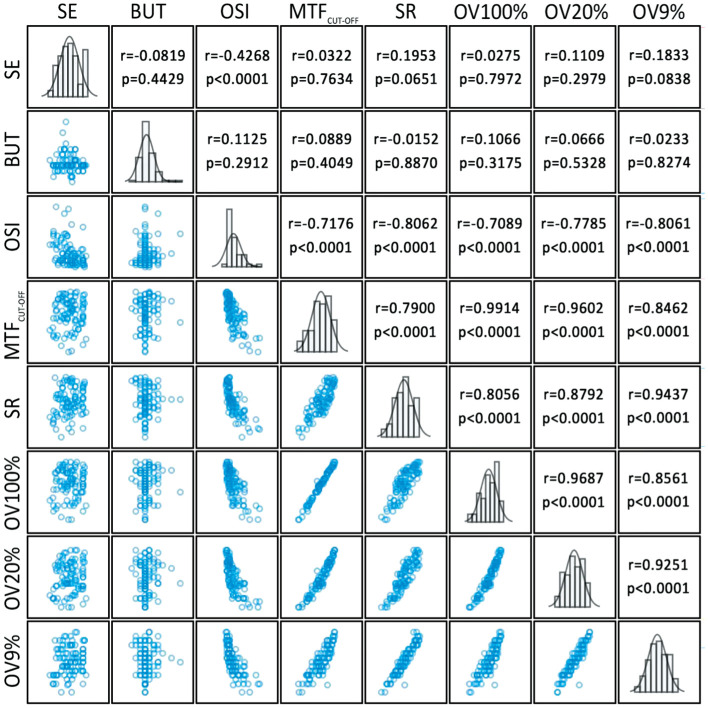
Figure 1. Scatterplot matrix showing the associations between SE, BUT, and parameters of objective visual quality.
SE: Spherical equivalent refraction; BUT: Break-up time; OSI: Scattering index; MTFcut-off: Modulation transfer function cut-off; SR: Strehl ratio; OV100%: The predictive visual acuity at contrasts of 100%; OV20%: The predictive visual acuity at contrasts of 20%; OV9%: The predictive visual acuity at contrasts of 9%.

