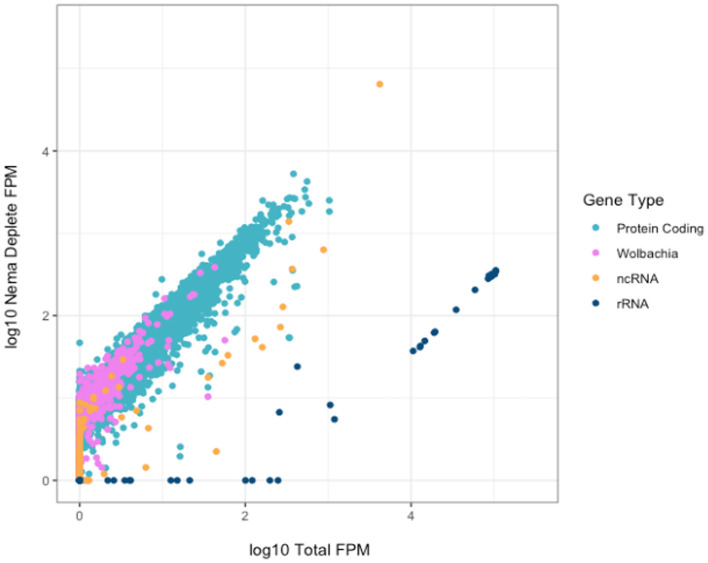
Figure 4.
Correlation of gene counts between B. malayi Total and Nema depletion libraries. Plot showing the log10 FPM gene counts for the total (x-axis) and custom probe depleted (y-axis) libraries, with rRNA genes in dark blue, protein coding genes in teal, non-coding RNAs in yellow and Wolbachia non-rRNA genes in pink.

