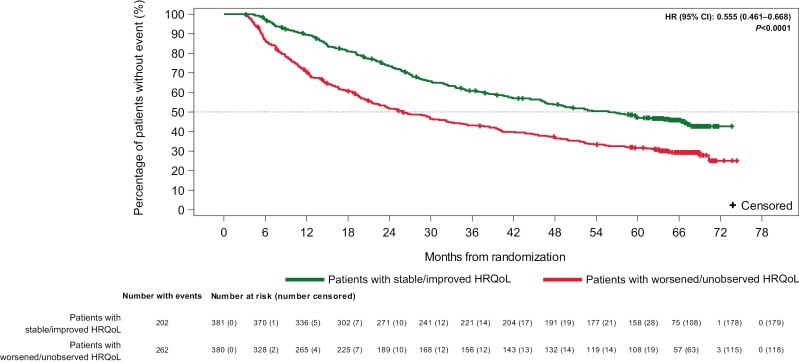
Figure 2.
Kaplan-Meier plot of OS by response in FKSI-19. Total score at the 3-month landmark (overall [threshold = 5]): patients with intermediate- or poor-risk RCC (all randomized)a. aHR is relative to patients with a worsening or unobserved HRQoL response, with HR < 1 favoring patients with stable or improved HRQoL. HR is derived from a stratified Cox regression model with response as the only covariate and strata as the randomization factors. The P-value corresponds to the Cox regression model.

