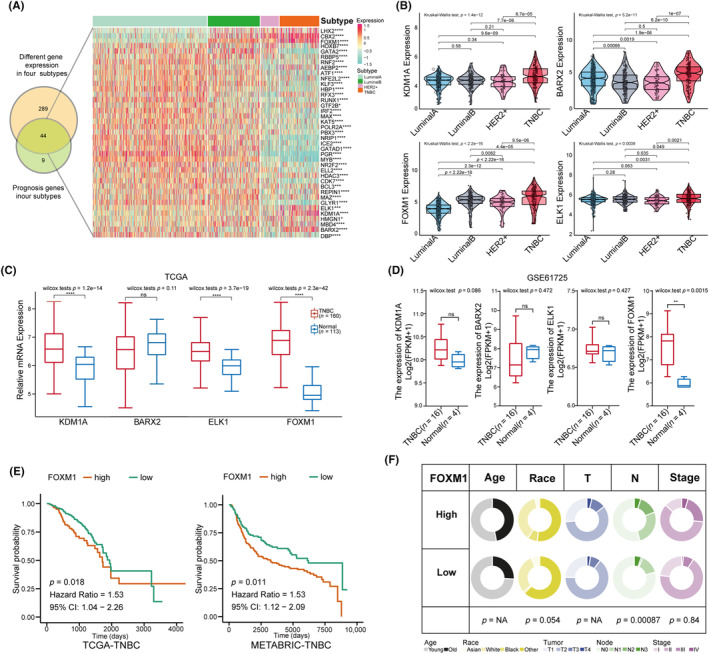
FIGURE 1.

Identification of significantly different expression of transcript factors (TFs), especially FOXM1 in triple‐negative breast cancer (TNBC). (A) Venn diagram intersecting the genes among 355 TFs differentially expressed in four BC subtypes and 53 prognostics TFs in four BC subtypes; the heatmap displays the 44 intersection TF genes in four BC subtypes. (B) Violin plots displaying a higher expression of four TFs in TNBC compared with other three subtypes (Kruskal–Wallis test analyzed for multiple groups and Student's t‐test used for two groups). (C, D) Box plots showing the differential expression of the KDM1A, BARX2, ELK1 and FOXM1 in TCGA data (TNBC‐TCGA vs. Normal‐TCGA) and validation data GSE61725 (TNBC vs. Normal). (E) Comparison of the overall survival between high and low FOMX1 groups in TCGA‐TNBC and in METABRIC‐TNBC cohorts with Kaplan–Meier curves. (F) Pie plots exhibiting the association between FOXM1 expression and clinical characteristics including age, race, tumor size, numbers of lymph nodes and tumor stage in the TNBC‐TCGA cohort using the chi‐squared test. Results are displayed as *p < 0.05, **p < 0.01, ***p < 0.001.
