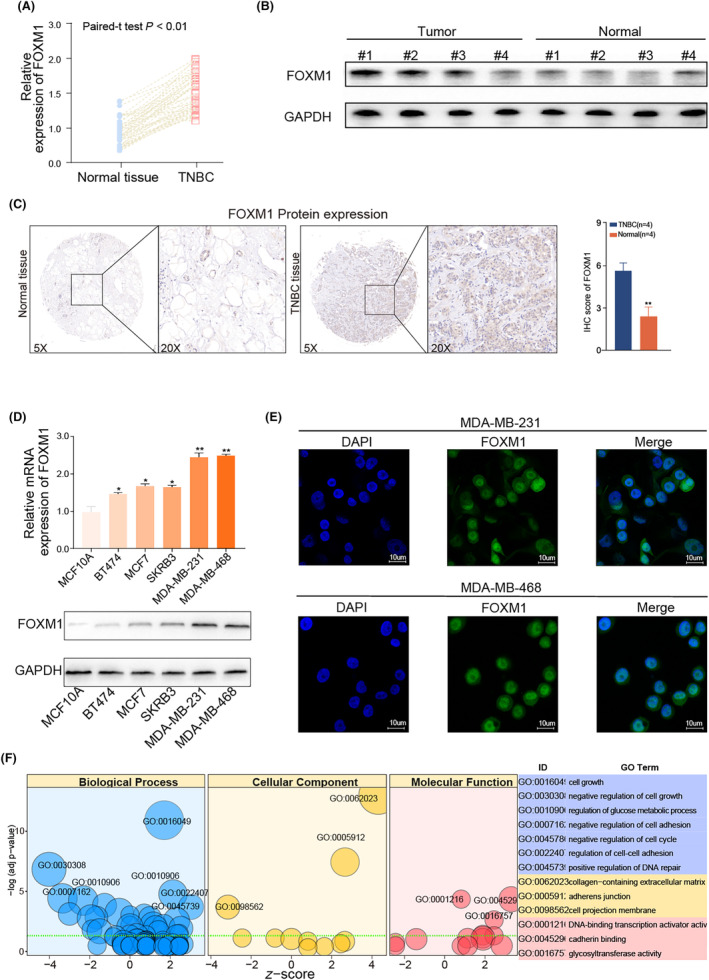
FIGURE 2.

FOXM1 expression is upregulated in TNBC samples and TNBC cell lines. (A) qRT‐PCR assay showing the increased expression of FOXM1 mRNA in TNBC tissue samples compared with the adjacent tissue (n = 64). (B) Western blot assay showing higher FOXM1 protein levels in eight representative TNBC samples compared with adjacent tissue. (C) Representative IHC images of FOXM1 protein expression in TNBC tissues and adjacent tissue. (D) qRT‐PCR assay and western blot assay showing the expression of FOXM1 among normal epithelial cell (MCF10A) and four subtypes of breast cancer cell lines. (E) Representative immunofluorescence imaging of FOXM1 expression and the subcellular localization was observed by fluorescence microscopy. (F) GO function analysis with FOXM1 in TNBC samples from TCGA database. Results are displayed as mean ± SD. *p < 0.05, **p < 0.01, ***p < 0.001.
