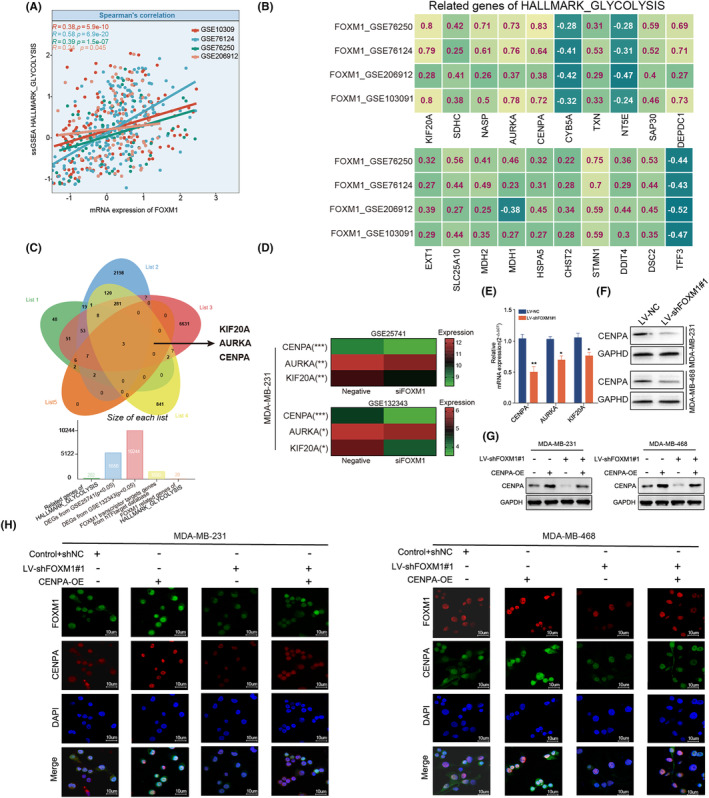
FIGURE 4.

The regulation of FOXM1 in glycolysis‐related genes. (A) Scatter plot showing the correlation between FOXM1 expression and enrichment score of HALLMARK_GLYCOLYSIS using ssGSEA in five datasets. (B) Spearman's Rho showed that the FOXM1 expression correlated with 20 glycolysis‐related genes in a HALLMARK_glycolysis geneset across four different GEO datasets. (C) Venn diagram indicating the three intersecting genes (KIF20A, AURKA and CENPA) from gene lists including two differentially expressed genes (DEGs) from GSE25741 and GSE132343, target genes of FOXM1 from hTFtargeted database and glycolysis‐related genes sets. (D) Heatmap showing the differential expression of CENPA, AURKA and KIF20A between untreated and silencing FOXM1 MDA‐MB‐231 cell line. (E) qRT‐PCR comparing the mRNA expression of KIF20A, AURKA and CENPA in LV‐shFOXM1 and LV‐NC TNBC cell lines. (F) Western blot comparing the protein expression of KIF20A, AURKA and CENPA in LV‐sh FOXM1 and LV‐NC TNBC cell lines. (G, H) Rescue experiments of western blot and immunofluorescence showing that CENPA overexpression recovered the CENPA protein expression in LV‐shFOXM1 cell lines. Results are displayed as mean ± SD. *p < 0.05, **p < 0.01, ***p < 0.001.
