Fig. 4.
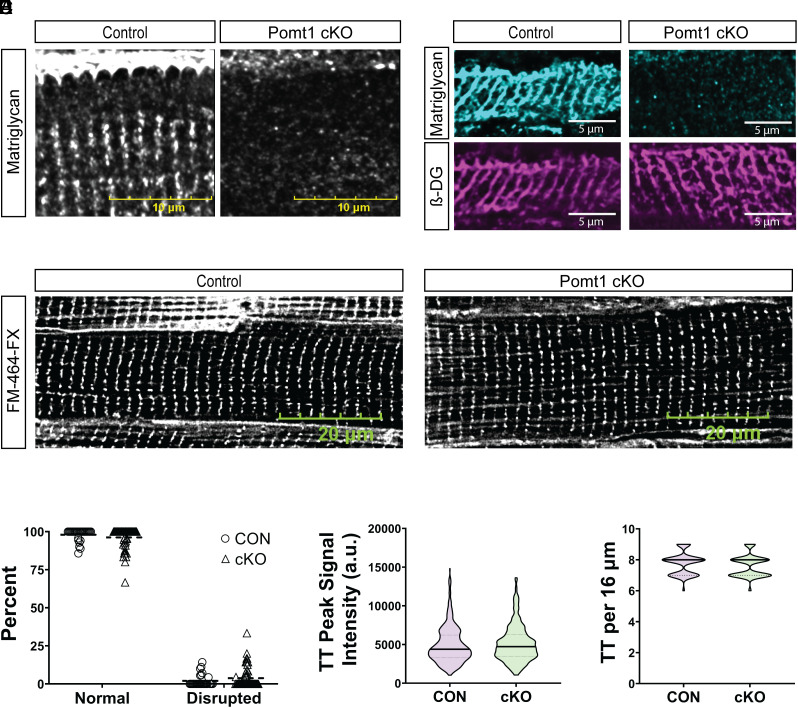
The t-tubule network develops in the absence of O-mannosylated α-DG. (A and B) Immunofluorescence of cryosections of ventricles from control and Pomt1 cKO mice to detect matriglycan (A and B) and β-DG (B). Ten µm cryosections were used in A. (Scale bar, 10 µm.) Sixteen µm cryosections were used in B. (Scale bar, 5 µm.) (C) FM 464-FX fluorescence of whole left ventricles to detect plasma membranes, including t-tubule membranes. (Scale bar, 20 µm.) (D) Quantification of the percent of myofibers with normal or disrupted t-tubule staining within a 90× magnification field. (E) Line scan analysis to determine the peak signal intensity of FM 464-FX labeled t-tubules (TT). (F) Number of t-tubules observed within 16 µm regions. Image analysis was performed on hearts of mice from both sexes (n = 4 controls; n = 5 cKO). Unpaired t tests with the Holm–Sidak post hoc test were performed. Data are expressed as mean ± SD.

