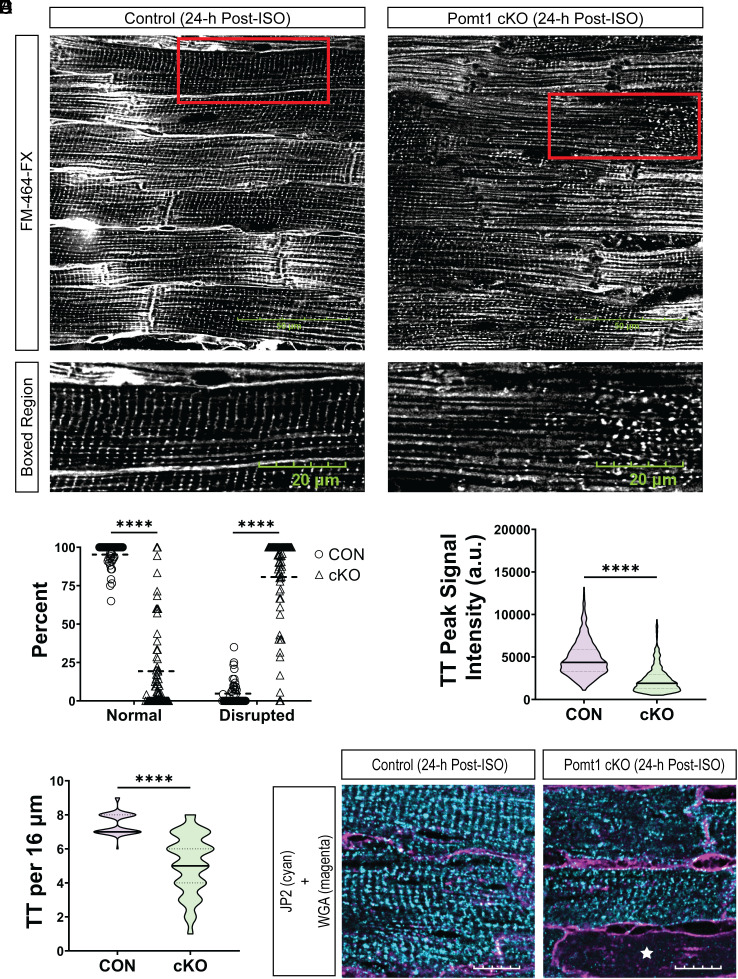
Fig. 5.
Pomt1 cKO ventricular myocytes exhibit detubulation and disruption of the cardiac dyad in response to contractile stress. (A) Labeling of control and Pomt1 cKO whole left ventricles stained with FM 464-FX 24-h after a single bolus of ISO (10 mg/kg body weight). (Scale bar, 50 µm.) Bottom images show the boxed region (red rectangular box) from the Upper images. (Scale bar, 20 µm.) (B) Percentage of myofibers that showed either normal or disrupted patterns of t-tubules. (C) Line scan analysis to determine the peak signal intensity of FM 464-FX labeled t-tubules (TT). (D) Number of t-tubules observed within a 16 µm region. Image analysis was performed on hearts of mice from both sexes (n = 4 controls; n = 5 cKO). Unpaired t tests with the Holm–Sidak post hoc test were performed. Data expressed as mean ± SD. ****P < 0.0001. (E) Immunofluorescence to detect JP2 and WGA-AlexaFluor 594 in hearts from mice subjected to a single bolus of ISO. (Scale bar, 10 µm.) The white star in the Pomt1 cKO image indicates a cardiomyofiber that lacked JP2 immunodetection.

