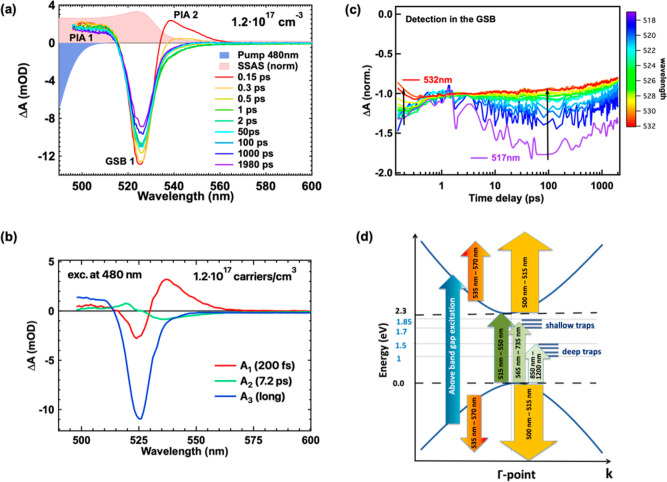
Figure 3.
(a) TA spectra after excitation at 480 nm with a photogenerated carrier density of 1.2 × 1017 cm–3. The steady-state absorption spectrum (red) and the pump pulse width used (blue) are also shown, with their amplitude being arbitrary. (b) Decay-associated spectra of the MAPbBr3 film excited at 480 nm. (c) Normalized TA dynamics at 3 ps probed at different wavelengths in the GSB 1; the arrows point toward longer probed wavelengths. (d) Band diagram of the MAPbBr3 film around the Γ-point along with the detected optical transitions.

