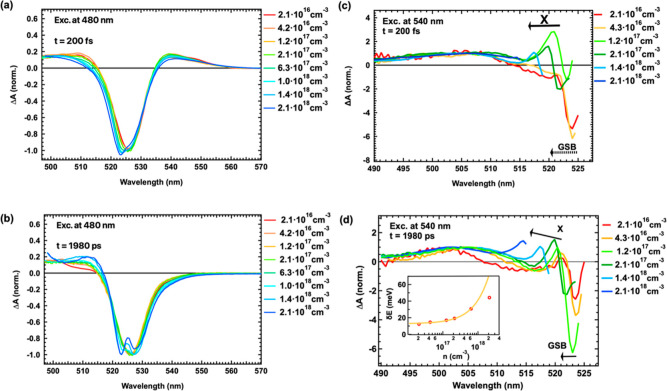
Figure 5.
TA spectra under various excitation densities with 480 nm excitation detected (a) at 200 fs and (b) at 1980 ps after excitation. TA spectra under various excitation densities with 540 nm excitation, detected (c) at 200 fs and (d) at 1980 ps after excitation. The inset in (d) displays the energy difference between the positive excitonic peak and that in the steady-state absorption spectrum. The analysis of the data with a linear function is included in the same graph. Here, a logarithmic scale is used for the x-axis.

