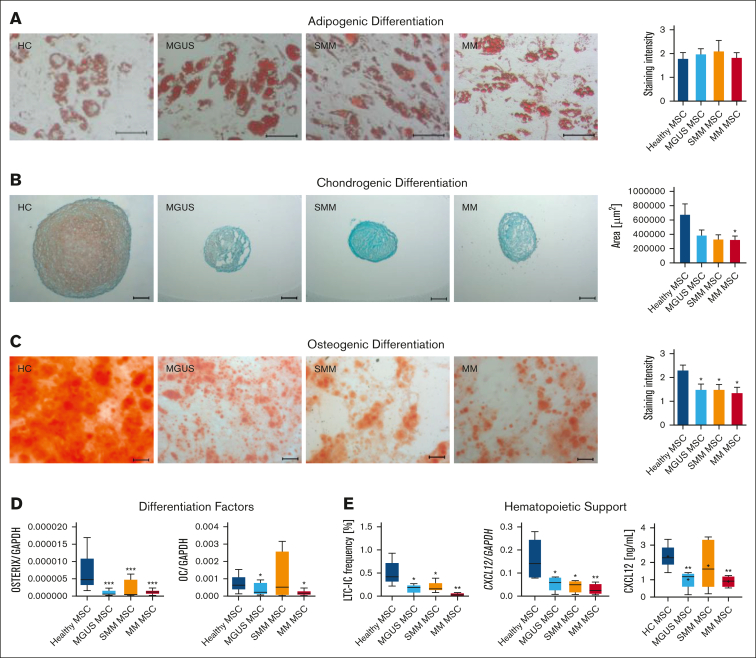
Figure 5.
Reduced differentiation capacity and hematopoietic support of MGUS, SMM and MM MSC. (A) Representative micrographics of lipid vacuoles after Oil Red O staining of adipogenic differentiated MGUS-, SMM- and MM-derived MSC after 21 days of differentiation. Scale bars indicating 100 μm are shown. (B) Bar charts of measured cartilage area of chondrogenic differentiated MGUS-, SMM- and MM-derived MSC after 21 days of differentiation, stained with Safranin O and representative micrographics of orange proteoglycan after staining. Scale bars indicating 100 μm are shown. Chondrogenic differentiation capacity was graded according to the area of chondrogenic pellets and according to microscopic analysis. (C) Osteogenic differentiation was induced for 14 days and stained with Alizarin Red. Differences of the osteogenic potential between healthy MSC and MGUS-, SMM- and MM-derived MSC were quantified and are shown in bar charts. Representative micrographics of healthy and MGUS-, SMM- and MM-derived MSC with scale bars indicating 100 μm. For quantification, adipogenic, chondrogenic and osteogenic differentiation capacity was graded according to microscopic analysis of staining intensity as: 0 = absent; 1 = weak; 2 = moderate; 3 = intensive as previously described.14 (D) mRNA expression level of osteogenic factors as OSTERIX and OSTEOCALCIN were measured by quantitative Realtime-PCR in healthy MSC and MGUS-, SMM- and MM-derived MSC. (E) Hematopoietic Support of MGUS, SMM and MM MSC. Left side: Bar charts showing LTC-IC frequency of healthy CD34+ HSPC cultured on healthy-, MGUS-, SMM- or MM-derived MSC. Colonies were calculated under light microscope and visualized in graph. Right side: mRNA expression level of CXCL12 was measured by quantitative Realtime-PCR in healthy MSC, MGUS-, SMM- and MM-derived MSC. CXCL12 protein level in conditioned media (CM) from healthy (n = 5), MGUS (n = 5), SMM (n = 6), MM (n = 4) were assessed by Enzyme-Linked Immunosorbent Assay. For all experiments, results are expressed as mean ±SEM. Asterisks display P-values ∗P ≤ .05; ∗∗ P ≤ .01; ∗∗∗ P ≤ .001.

