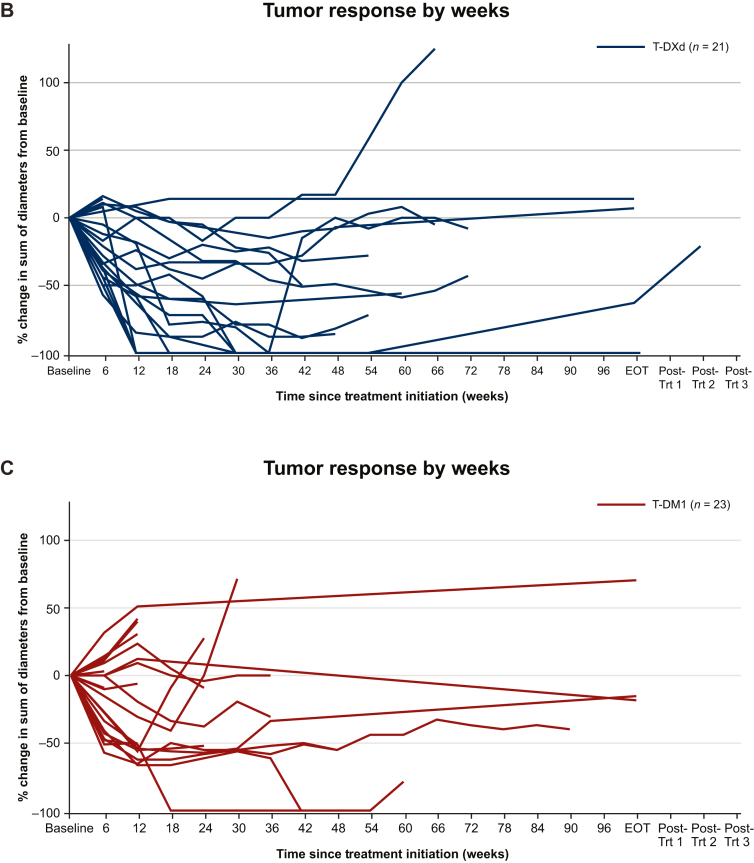
Figure 3.
Waterfall and spider plots of brain lesion measurements. (A) Best percentage change in sum of diameters of measurable intracranial lesions from baseline in patients with BMs. The red line at 20% indicates PD; the black line at −30% indicates PR. ∗Patients without prior radiation therapy to the brain. Brain lesion measurements over time in (B) the T-DXd subgroup and (C) the T-DM1 subgroup.
BM, brain metastases; EOT, end of treatment; T-DM1, trastuzumab emtansine; T-DXd, trastuzumab deruxtecan; Trt, treatment.


