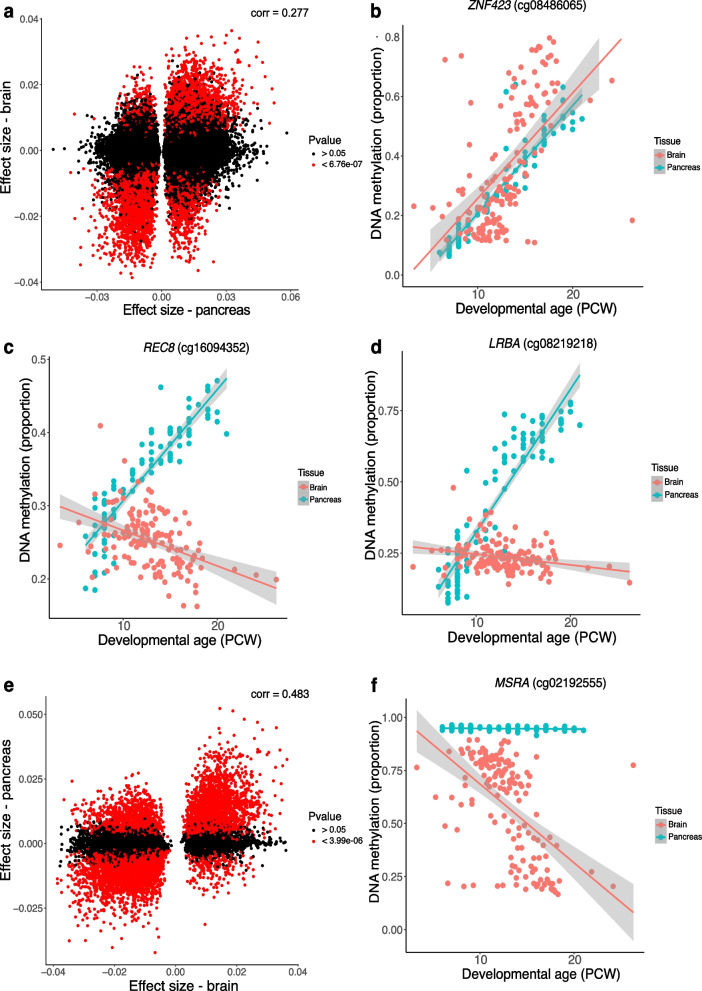
Fig. 7.
Overlap between developmental changes in DNA methylation between pancreas and brain. A Correlation of effect sizes at pancreas dDMPs with those at the same sites in the developing brain. B A site at which developmental changes in DNA methylation is highly similar between pancreas and brain. Shown is cg08486065 which is characterized by significant decrease in DNA methylation across development in both pancreas (effect size = 0.0362, P = 1.06 × 10–54) and brain (effect size = 0.0341, P = 1.38 10–12). C A site at which DNA methylation changes significantly across development in the pancreas and brain but in the opposite direction. Shown is cg16094352 which is characterized by significant hypermethylation across development in the pancreas (effect size = 0.0151, P = 3.13 × 10–41) but significant hypomethylation across development in the brain (effect size = -0.00484, P = 1.68 × 10⁻⁸). D A site at which developmental changes in DNA methylation are specific to the pancreas. Shown is cg08219218 annotated to LBRA that is characterized by significant hypermethylation across development in the pancreas (effect size = 0.0490, P = 4.52 × 10–41) but no change in the brain. E Correlation of effect sizes at brain dDMPs with those at the same sites in the developing pancreas. F A site at which developmental changes in DNA methylation are specific to the brain. Shown is cg02192555 annotated to MSRA that is characterized by significant hypomethylation across development in the brain (effect size = -0.0371, P = 3.86 × 10⁻¹²) but no change in the pancreas

