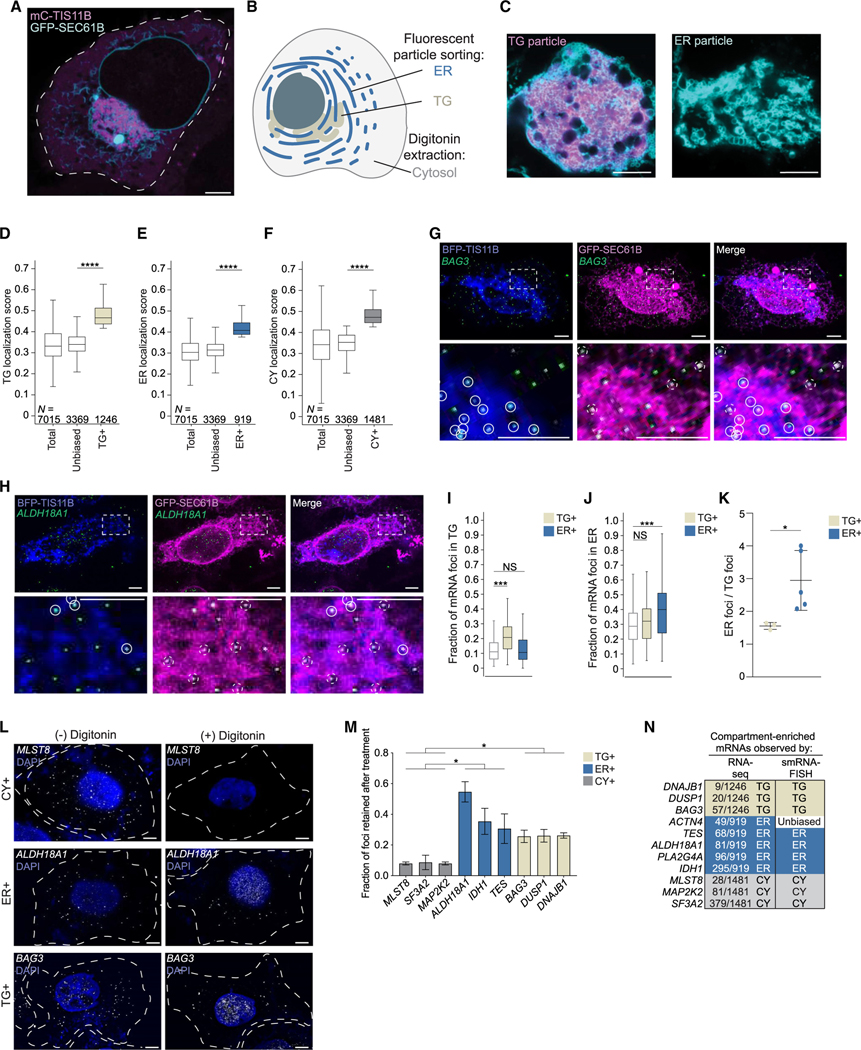
Figure 1. Strategy to identify compartment-enriched mRNAs.
(A) Confocal live cell imaging of HeLa cells after transfection of mCherry (mC)-TIS11B and GFP-SEC61B to visualize TGs and the rough ER. Scale bars, 5 μm.
(B) Schematic of a cell with three cytoplasmic compartments.
(C) As in (A) but showing fluorescent TG (left) and ER (right) particles.
(D) Transcript localization scores obtained from TG samples. Mann-Whitney test, p = 0. Boxplots depict median, 25th and 75th percentiles (box), and 5% and 95% confidence intervals (error bars).
(E) Transcript localization scores obtained from ER samples. Mann-Whitney test, p = 1 × 10−123.
(F) Transcript localization scores obtained from CY samples. Mann-Whitney test, p = 0.
(G) smRNA-FISH of endogenous TG+ mRNA BAG3 (green) in HeLa cells. TIS granules (BFP-TIS11B, blue) and the ER (GFP-SEC61B, magenta) were simultaneously visualized. Bottom panel shows 5 × zoom-in of boxed area. White circles: mRNA colocalization with TG, dashed white circles: mRNA colocalization with ER. Representative images are shown. Scale bars, 5 μm.
(H) As in (G), but smRNA-FISH of the ER+ mRNA ALDH18A1.
(I) Quantification of smRNA-FISH foci. White boxplot: expected fraction of mRNA transcripts based on TG compartment size (n = 186 cells). ***p = 5 × 10⁻¹¹ (Mann-Whitney test). Additional images in Figures S2A–S2F. Individual values are shown in Figures S2H and S2I.
(J) As in (I). White boxplot: expected fraction of mRNA transcripts based on ER compartment size (n = 186 cells). ***p = 1 × 10⁻⁶.
(K) The ratio of smRNA-FISH foci colocalizing with the ER compared with the foci colocalizing with TGs, shown for mRNAs from (I) and (J). t test for independent samples, *p = 0.044. Horizontal line, median; error bars; 25th and 75th percentiles.
(L) smRNA-FISH foci of endogenous mRNAs in HeLa cells before (−) and after (+) digitonin extraction. Dotted lines indicate cell boundaries. Representative images are shown. Scale bars, 5 μm.
(M) Quantification of (L). Shown is the fraction of digitonin-resistant smRNA-FISH foci of endogenous mRNAs as mean ± SD of three independent experiments. Number of cells analyzed, see Table S2. Additional images in Figures S3A–S3C. t test for independent samples, *p < 0.041.
(N) smRNA-FISH validation summary. Shown is ranking obtained from localization scores.

