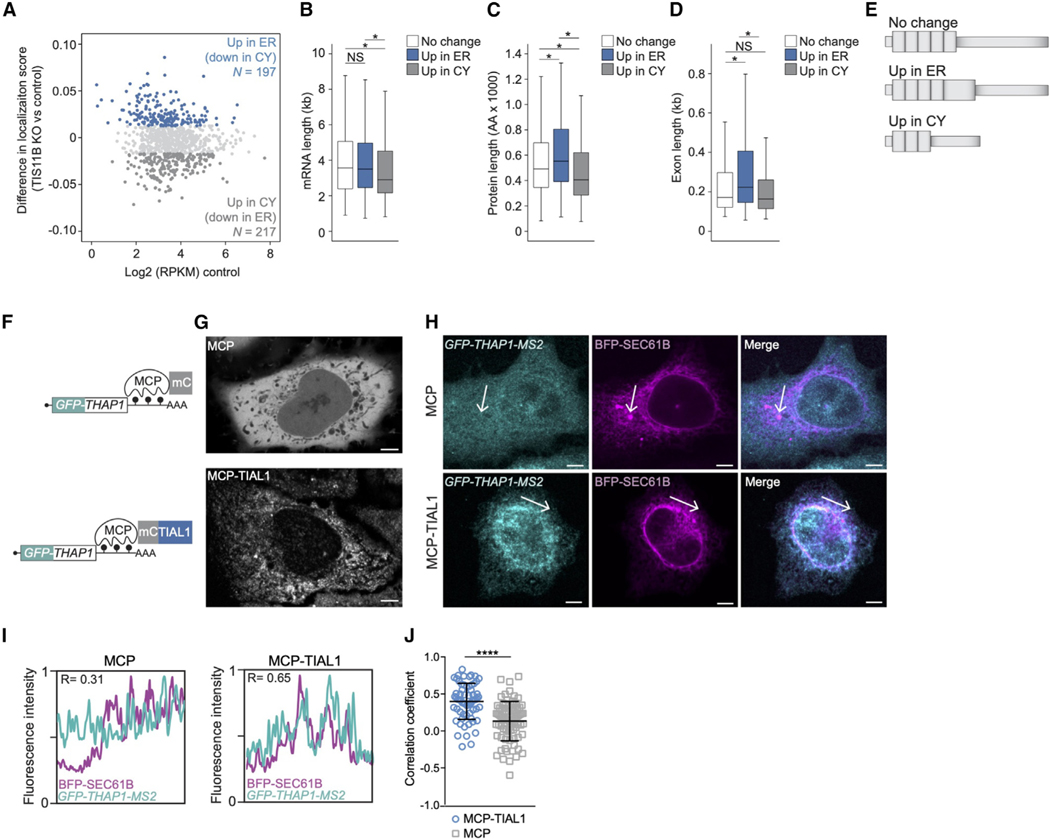
Figure 4. Experimental validation of regulators of subcytoplasmic mRNA transcript distribution.
(A) TG+ mRNAs are shown and are color-coded based on their change in compartment localization. No change (N = 508).
(B) Length distribution of mRNAs from (A). Mann-Whitney test p values as in Figure 2A.
(C) As in (B) but for protein size distribution. Boxplots depict median, 25th and 75th percentiles (box), and 5% and 95% confidence intervals (error bars).
(D) As in (B) but for CDS exon length distribution.
(E) As in Figure 3E but for mRNA features of TG+ mRNAs that change their localization upon TIS11B KO.
(F) Schematic of mRNA reporter for validation of a 3′ UTR-bound RBP on mRNA localization. The GFP-THAP1 reporter mRNA contains MS2 hairpins as 3′ UTR, which bind to cotransfected MS2 coat protein (mCherry-tagged MCP). TIAL1-MCP fusion tethers TIAL1 to the reporter 3′ UTR. mC, mCherry.
(G) Confocal live cell imaging of HeLa cells expressing the indicated constructs. Scale bars, 5 μm.
(H) RNA-FISH (teal) of the GFP reporter mRNA from (F) in HeLa cells. GFP-SEC61B visualizes the rough ER (magenta). Representative images are shown. Scale bars, 5 μm.
(I) Pearson’s correlation coefficients of fluorescence intensities at arrows in (H).
(J) Quantification of (H) and (I). MCP (n = 26 cells), MCP-TIAL1 (n = 21). Horizontal line: median, error bars: 25th, 75th percentiles. Mann-Whitney test, ****p < 0.0001.

