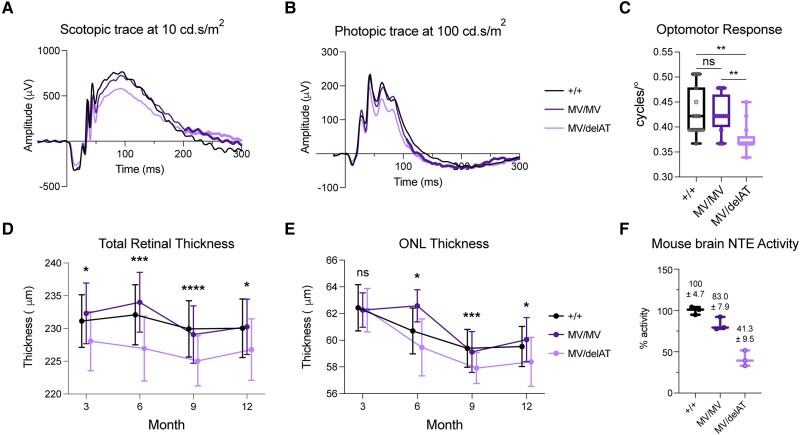
Figure 4.
Residual NTE activity determines the loss of visual function and structure in PNPLA6 allelic series mice in a dose-dependent manner. (A) Scotopic electroretinogram (ERG) trace at maximum stimulus intensity (10 cd.s/m2) for our photopic imaging protocol. (B) Photopic ERG trace at maximum stimulus intensity (100 cd.s/m2) for our scotopic imaging protocol. (C) Optomotor response (OMR) (+/+ n = 15, MV/MV n = 12, MV/delAT n = 13) of allelic series mice at 3 months. (D) Time course of total retinal thickness of optical coherence tomography (OCT) images. Significant values are between Control and MV/delAT values. Control and MV/MV line were not significantly different, and MV/MV and MV/delAT were significantly different. (E) Time course of outer nuclear layer (ONL) thickness of OCT images. Significant values are between Control and MV/delAT values. Control and MV/MV line were not significantly different, and MV/MV and MV/delAT were significantly different. (F) Neuropathy target esterase (NTE) activity of allelic series mice brain homogenate. Each time point took measurements from littermates, and bars in E and F are offset for cleaner presentation. All error bars in standard deviations. Box and whisker plots extend from the 25th to 75th percentiles, with whiskers extending to the minimum and maximum values in the dataset. The median is the line plotted between boxes. Statistical tests from these figures used one-way ANOVA with post hoc Tukey test with α = 0.05. P > 0.05 (not significant, ns), *P < 0.05, **P < 0.01, ***P < 0.001, ****P < 0.0001. See Supplementary material, ‘Supporting data values’ file for exact mean, n and standard deviation values.

