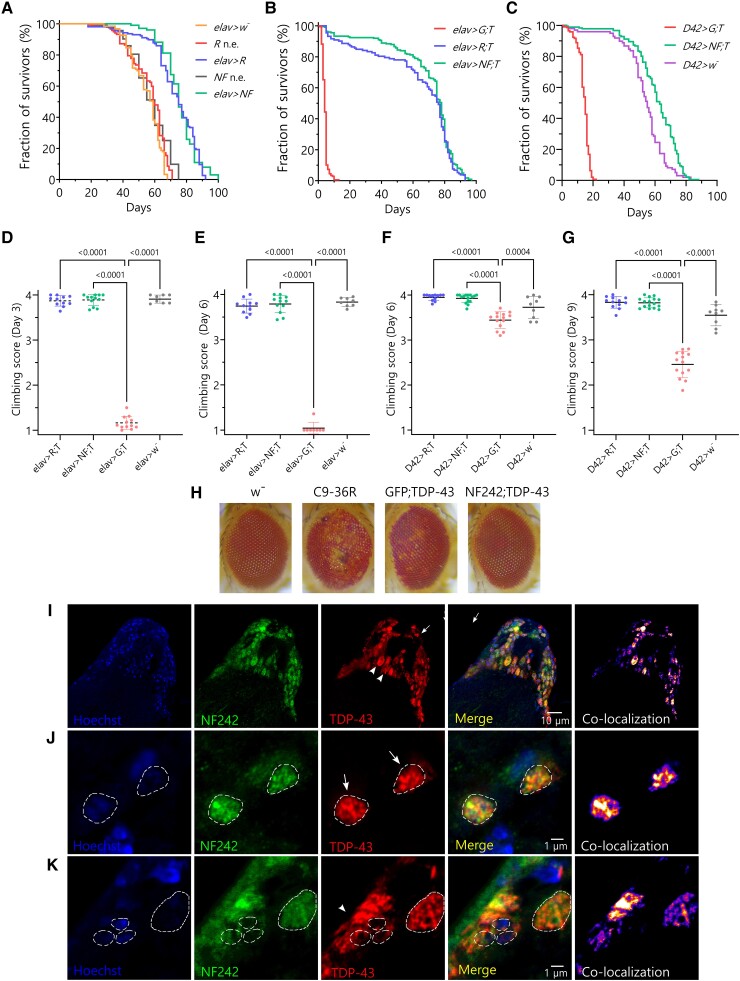
Figure 4.
Co-expression of RGNEF or NF242 with TDP-43 in fruit flies. (A) Kaplan-Meier graph showing the survival of elav>RGNEF (elav>R; n = 156), elav>NF242 (elav>NF; n = 101) RGNEF no driver control (R n.e.; n = 117), NF242 no driver control (NF n.e.; n = 93) and elav>w− (control of driver crossed with parental line; n = 123). The elav>RGNEF line shows an increased lifespan compared to RGNEF no driver control (P = 0.0035) and elav>w− (P < 0.0001) lines. The elav>NF242 line shows an increased lifespan compared to NF242 no driver control (P < 0.0001) and elav>w− (P < 0.0001) lines. (B) Kaplan-Meier graph showing the survival of elav>GFP;TDP-43wt (elav>G; T; n = 178), elav>RGNEF;TDP-43wt (elav>R; T, n = 132) and elav>NF242;TDP-43wt (elav>NF; T, n = 224). The elav>GFP;TDP-43wt line shows a reduced lifespan, an effect that is suppressed in the elav>RGNEF; TDP-43wt (P < 0.0001) and elav>NF242;TDP-43wt (P < 0.0001) lines. (C) Kaplan-Meier graph showing the survival of D42>GFP; TDP-43wt (D42>G; T; n = 143), D42>NF242;TDP-43wt (D42>NF; T, n = 181) and D42>w− (control of driver crossed with parental line, n = 98). The D42>GFP;TDP-43wt line shows a reduced lifespan, an effect that is suppressed in the D42>NF242 line (P < 0.0001). The latter also show an increase in lifespan compared to the control D42>w− line (P < 0.0001). (D and E) Negative geotaxis assay showing the climbing score at Days 3 and 6 for elav>RGNEF;TDP-43wt (elav>R; T, n = 11; 110 flies), elav>NF242;TDP-43wt (elav>NF; T, n = 12, 120 flies), elav>GFP;TDP-43wt (elav>G; T; with n = 12; 120 flies at Day 1) and elav>w− (n = 8; 80 flies) lines. The elav>GFP;TDP-43wt line shows a severe motor phenotype that is suppressed when RGNEF or NF242 is co-expressed with TDP-43wt in neurons (P < 0.0001). (F and G) Negative geotaxis assay showing the climbing score at Days 6 and 9 for D42>RGNEF;TDP-43wt (D42>R; T, n = 12; 120 flies) and D42>NF242;TDP-43wt (D42>NF; T, n = 16, 160 flies), D42>GFP;TDP-43wt (D42>G; T; n = 14; 140 flies) and D42>w− (n = 9; 90 flies). The D42>GFP; TDP-43wt line shows a significant motor phenotype that is suppressed when RGNEF or NF242 is co-expressed with TDP-43wt in motor neurons (P < 0.0001). (H) Representative images showing the eye phenotype of GMR>w− (negative control), GMR>36R (positive control), GMR>GFP;TDP-43wt and GMR>NF242;TDP-43wt lines. NF242 co-expression with TDP-43wt suppresses the eye degeneration observed in the GMR>NF242;TDP-43wt line. (I) Immunofluorescence of adult elav>NF242;TDP-43wt fly brain tissue showing the co-localization between NF242 and TDP-43wt in neurons. (J and K) Confocal images at higher magnification of adult elav>NF242;TDP-43wt fly brain tissue showing the co-aggregation between NF242 and TDP-43wt in neurons. Nuclei are indicated with dashed lines. Arrows show nuclear co-localization and arrowheads cytoplasmic co-localization.

