Figure 3.

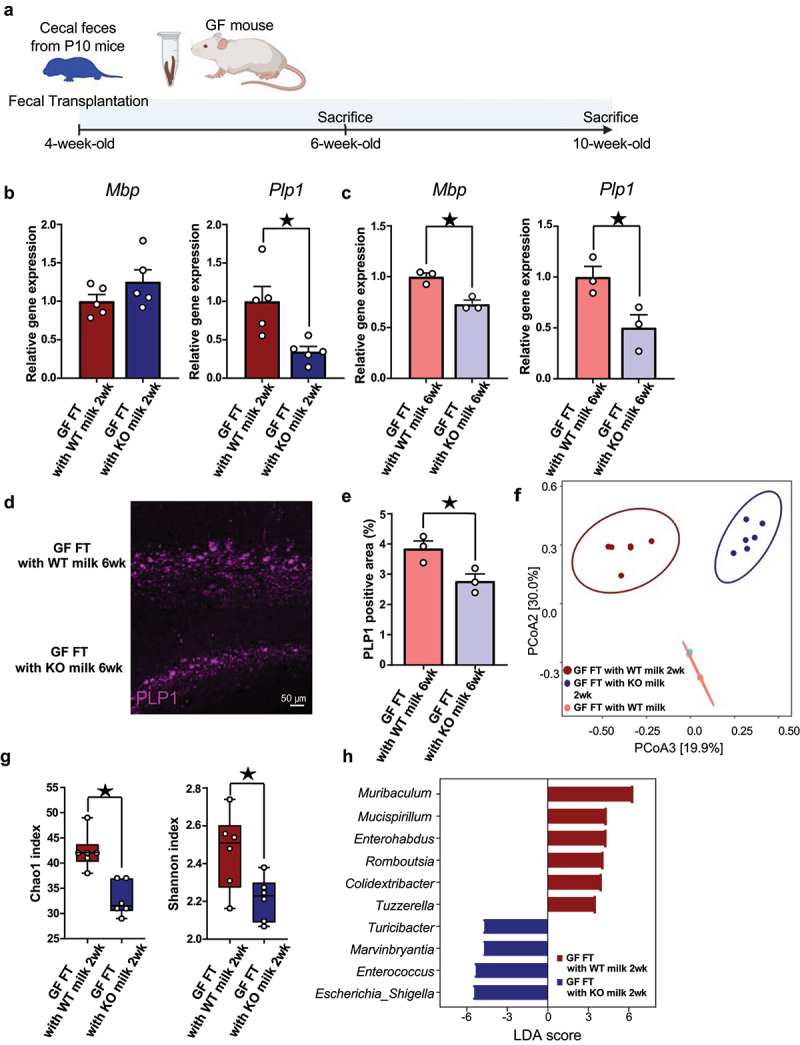
Fecal transplants from different breastfed neonates affect myelin-related gene expression in germ-free mice.
(a) Schematic overview illustrated the experiment design, in which GF mice were orally gavaged with cecum feces from P10 mice. Sampling was performed 2 and 6 weeks after fecal transplantation Created with BioRender.com.
(b) Quantitative real-time polymerase chain reaction (qRT-PCR) of Mbp and Plp1 using hippocampus from 2 weeks after FT mice. Mbp (n = 5 each, t8 = 1.42, p = 0.19, Student’s t-test), Plp1 (n = 5 each, t8 = 3.20, p < 0.05, Student’s t-test).
(c) QRT-PCR of Mbp and Plp1 using hippocampus from 6 weeks after FT mice. Mbp (n = 3 each, t4 = 5.05, p < 0.05, Student’s t-test), Plp1 (n = 3 each, t4 = 3.04, p < 0.05, Student’s t-test).
(d and e) Representative PLP1 expression at dorsal hippocampus from FT mice. Quantification of PLP1 positive area at dorsal hippocampus from FT mice. n = 3 each, t4 = 3.13, p < 0.05, Student’s t-test.
(f) Beta diversity of the 16S rRNA gene sequencing data sets from FT mice feces was determined using the Bray-Curtis index‘s principal coordinate analysis (PCoA). n = 6 each, F = 19.47, R-squared = 0.74, p < 0.05, PARMANOVA.
(g) Alpha-diversity was evaluated by chao1 and Shannon index. chao1 (n = 6 each, U = 0, p < 0.05, Mann-Whitney U test), Shannon (n = 6 each, U = 5, p < 0.05, Mann-Whitney U test)
(h) Histogram of genus-level taxa with p-values <0.05 evaluated by LEfSe analysis were visualized. n = 6 each.
Mean ± SEM; ★ indicates p < 0.05; GF, germ-free; FT, fecal transplantation; KO, knockout; WT, wild-type; 2 wk, two weeks after fecal transplantation; 6 wk, six weeks after fecal transplantation; LDA, linear discriminant analysis.
