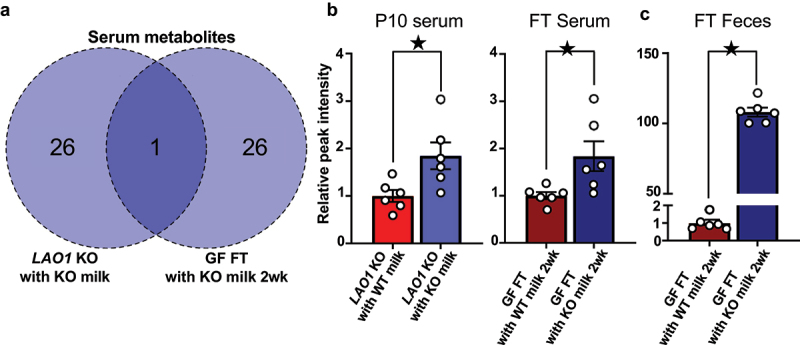
Figure 4.

Gut microbiota influenced by LAO1 deficient augmented D-glucaric acid in serum and cecum feces.
(a) Venn diagram of the P10 serum and FT serum metabolomics datasets from LAO1 KO with KO milk-related samples constructed by naïve-partial least squares (PLS) analysis. Overlapped metabolite was D-glucaric acid. Blue indicated higher in LAO1 KO with KO milk compared to LAO1 WT with KO milk. Dark blue indicated higher in GF FT with KO milk 2 wk compared to GF FT with WT milk 2 wk, and the numbers inside the Venn diagram indicate the metabolite counts that were elevated in each sample compared to the comparator.
(b) Relative peak intensity of D-glucaric acid from P10 serum, FT serum, and FT feces measured using gas chromatography-mass spectrometry (GC-MS) based metabolomics analysis. P10 serum (n = 6 each, t10 = 2,75, p < 0.05, Student’s t-test), FT serum (n = 6 each, t10 = 2.56, p < 0.05, Student’s t-test), FT feces (n = 6 each, t10 = 33.44, p < 0.05, Student’s t-test).
Mean ± SEM; ★ indicates p < 0.05; P, postnatal day; FT, fecal transplantation; KO, knockout; 2 wk, two weeks after fecal transplantation.
