Figure 5.

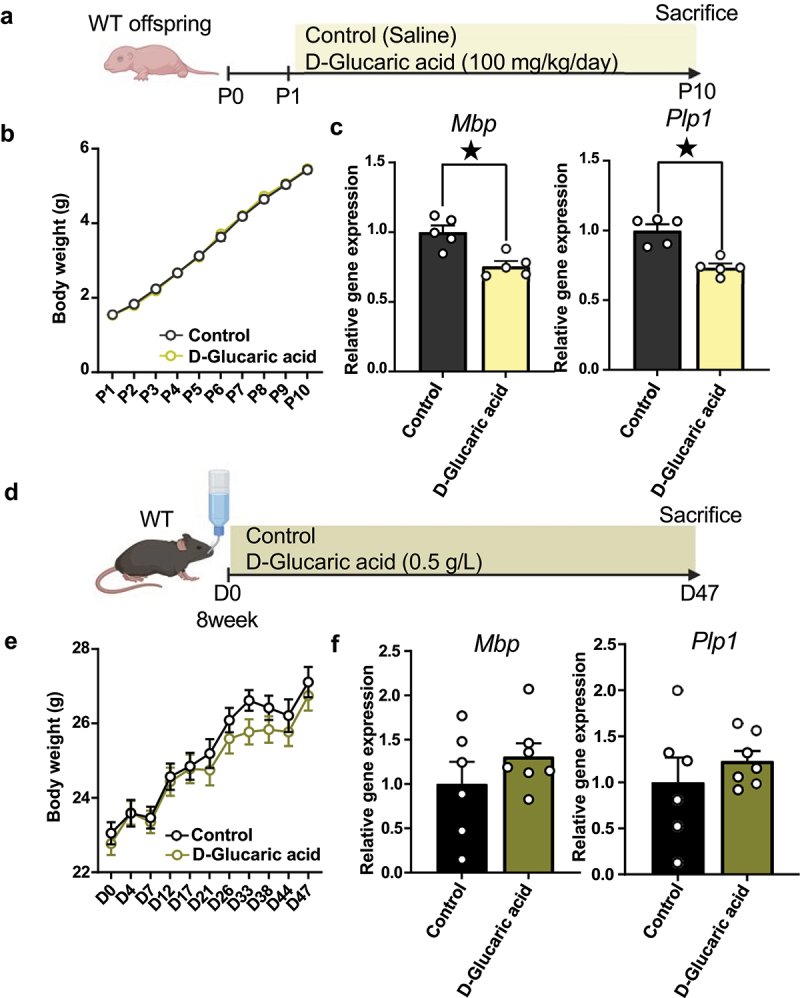
D-glucaric acid suppressed myelin-related gene expression in neonatal mice.
(a) D-glucaric acid impact on neonatal hippocampal myelin-related gene was investigated, and the schematic diagram was illustrated. Created with BioRender.com.
(b) Body weight of P1–P10 100 mg/kg glucaric acid-treated mice. P1 (Control n = 18, D-Glucaric acid n = 19, t350 = 0.02, p > 0.99, Sidak’s tests), P2 (Control n = 18, D-Glucaric acid n = 19, t350 = 0.39, p > 0.99, Sidak’s tests), P3 (Control n = 18, D-Glucaric acid n = 19, t350 = 0.58, p > 0.99, Sidak’s tests), P4 (Control n = 18, D-Glucaric acid n = 19, t350 = 0.02, p > 0.99, Sidak’s tests), P5 (Control n = 18, D-Glucaric acid n = 19, t350 = 0.32, p > 0.99, Sidak’s tests), P6 (Control n = 18, D-Glucaric acid n = 19, t350 = 0.91, p = 0.99, Sidak’s tests), P7 (Control n = 18, D-Glucaric acid n = 19, t350 = 0.26, p > 0.99, Sidak’s tests), P8 (Control n = 18, D-Glucaric acid n = 19, t350 = 0.96, p = 0.98, Sidak’s tests), P9 (Control n = 18, D-Glucaric acid n = 19, t350 = 0.28, p > 0.99, Sidak’s tests), P10 (Control n = 18, D-Glucaric acid n = 19, t350 = 0.35, p > 0.99, Sidak’s tests).
(c) Quantitative real-time polymerase chain reaction (qRT-PCR) of Mbp and Plp1 using hippocampus from P10 mice. Mbp (n = 5 each, t8 = 4.03, p < 0.05, Student’s t-test), Plp1 (n = 5 each, t8 = 5.16, p < 0.05, Student’s t-test).
(d) D-glucaric acid impact on adult hippocampal myelin-related gene was investigated, and the schematic diagram was illustrated. Created with BioRender.com.
(e) Body weight of D1–D47 in glucaric acid-treated mice. D0 (Control n = 10, D-Glucaric acid n = 11, t19 = 0.65, p > 0.99, Sidak’s tests), D4 (Control n = 10, D-Glucaric acid n = 11, t19 = 0.02, p > 0.99, Sidak’s tests), D7 (Control n = 10, D-Glucaric acid n = 11, t19 = 0.27, p > 0.99, Sidak’s tests), D12 (Control n = 10, D-Glucaric acid n = 11, t19 = 0.26, p > 0.99, Sidak’s tests), D17 (Control n = 10, D-Glucaric acid n = 11, t19 = 0.13, p > 0.99, Sidak’s tests), D21 (Control n = 10, D-Glucaric acid n = 11, t19 = 0.79, p = 0.99, Sidak’s tests), D26 (Control n = 10, D-Glucaric acid n = 11, t19 = 0.97, p = 0.99, Sidak’s tests), D33 (Control n = 10, D-Glucaric acid n = 11, t19 = 1.94, p = 0.54, Sidak’s tests), D38 (Control n = 10, D-Glucaric acid n = 11, t19 = 1.21, p = 0.95, Sidak’s tests), D44 (Control n = 10, D-Glucaric acid n = 11, t19 = 0.75, p > 0.99, Sidak’s tests), D47 (Control n = 10, D-Glucaric acid n = 11, t19 = 0.64, p > 0.99, Sidak’s tests).
(f) qRT-PCR of Mbp and Plp1 using hippocampus from treated adult mice. Mbp (Control n = 6, D-Glucaric acid n = 7, t11 = 0.29, p = 0.29, Student’s t-test), Plp1 (Control n = 6, D-Glucaric acid n = 7, t11 = 0.85, p = 0.41, Student’s t-test).
Mean ± SEM; ★ indicates p < 0.05; P, postnatal day; D, day.
