Figure 6.

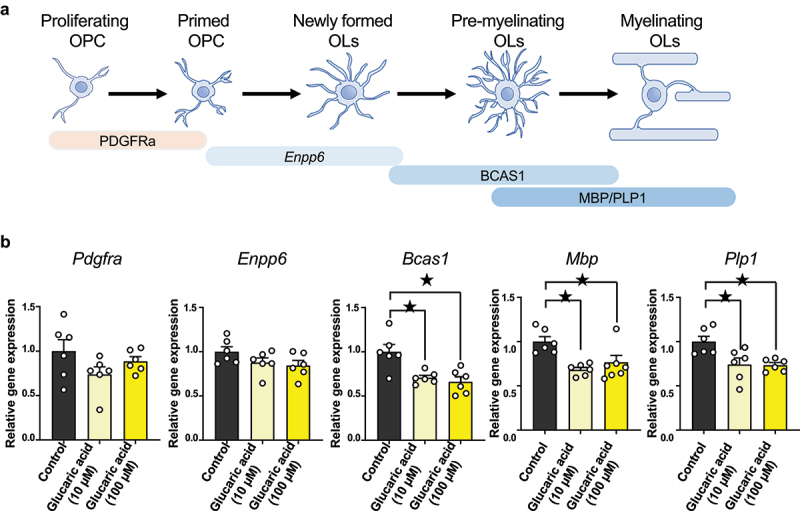
D-glucaric acid treatment induces gene expression change in OPC differentiation-conditioned cells.
(a) Representative OPC to myelinating OL marker. Pdgfra is a progenitor marker. Enpp6 is the pre- and immature OL marker. Bcas1 represents pre- and immature OL to myelinating OL marker. Mbp and Plp1 are myelinating OL markers.
(b) Quantitative real-time polymerase chain reaction (qRT-PCR) of Pdgfra, Enpp6, Bcas1, Mbp, and Plp1 from OPC differentiation-conditioned cells. Pdgfra (n = 6 each, Control versus Glucaric acid 10 μM: q15 = 1.99, p = 0.11, Control versus Glucaric acid 100 μM: q15 = 0.86, p = 0.61, Dunnett’s test), Enpp6 (n = 6 each, Control versus Glucaric acid 10 μM: q15 = 1.57, p = 0.23, Control versus Glucaric acid 100 μM: q15 = 0.20, p = 0.11, Dunnett’s test), Bcas1 (n = 6 each, Control versus Glucaric acid 10 μM: q15 = 3.50, p < 0.05, Control versus Glucaric acid 100 μM: q15 = 4.04, p < 0.05, Dunnett’s test), Mbp (n = 6 each, Control versus Glucaric acid 10 μM: q15 = 3.92, p < 0.05, Control versus Glucaric acid 100 μM: q15 = 2.87, p < 0.05, Dunnett’s test), Plp1 (n = 6 each, Control versus Glucaric acid 10 μM: q15 = 3.21, p < 0.05, Control versus Glucaric acid 100 μM: q15 = 3.30, p < 0.05, Dunnett’s test).
Mean ± SEM; ★ indicates p < 0.05; OPC, oligodendrocyte precursor cells; OL, oligodendrocytes.
