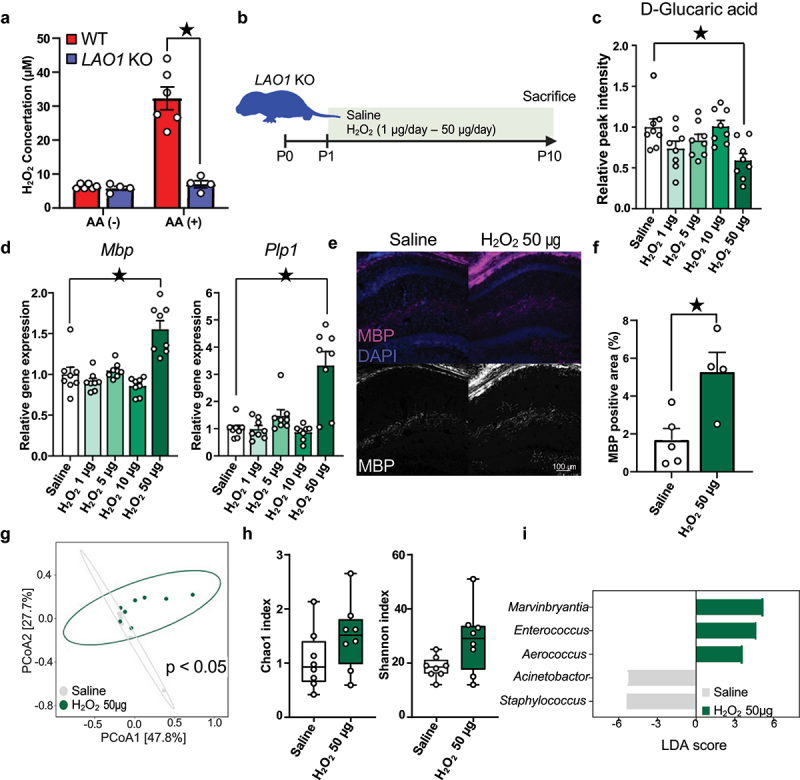
Figure 7.

H2O2 ameliorates myelin-related gene expression and D-glucaric acid production in neonatal mice.
(a) H2O2 concentration after incubating skim milk with or without amino acids (AA). AA (-) (WT milk n = 6, LAO1 KO milk n = 4, t8 = 0.83, p = 0.43, Student’s t-test.), AA (+) (WT milk n = 6, LAO1 KO milk n = 4, t8 = 5.89, p < 0.05, Student’s t-test).
(b) Investigated the impact of orally administrated H2O2 to neonatal LAO1 KO mice, and the schematic diagram was illustrated. Created with BioRender.com.
(c) Relative peak intensity of D-glucaric acid from serum metabolomics. n = 8 each, Saline versus H2O2 1 μg/day: q35 = 2.167, p = 0.12, Saline versus H2O2 5 μg/day: q35 = 1.35, p = 0.47, Saline versus H2O2 10 μg/day: q35 = 0.07, p = 0.99, Saline versus H2O2 50 μg/day: q35 = 3.36, p < 0.05, Dunnett’s test.
(d) Quantitative real-time polymerase chain reaction (qRT-PCR) of Mbp and Plp1 using the hippocampus of H2O2-supplemented 10-day-old neonates. Mbp (n = 8 each, Saline versus H2O2 1 μg/day: q35 = 1.533, p = 0.36, Saline versus H2O2 5 μg/day: q35 = 0.1739, p = 0.99, Saline versus H2O2 10 μg/day: q35 = 2.21, p = 0.11, Saline versus H2O2 50 μg/day: q35 = 6.006, p < 0.05, Dunnett’s test), Plp1 (n = 8 each, Saline versus H2O2 1 μg/day: q35 = 0.4061, p = 0.98, Saline versus H2O2 5 μg/day: q35 = 1.061, p = 0.67, Saline versus H2O2 10 μg/day: q35 = 0.7489, p = 0.87, Saline versus H2O2 50 μg/day: q35 = 7.767, p < 0.05, Dunnett’s test).
(e and f) Representative myelin basic protein (MBP) staining and quantitative analysis of P10 LAO1 KO mice dorsal hippocampus. Saline n = 5, H2O2 50 μg/day n = 4, t7 = 3.14, p < 0.05, Student’s t-test.
(g) Beta diversity of the 16S rRNA gene sequencing data sets from Saline and H2O2 50 μg/day-administrated LAO1 KO neonate feces as determined using principal coordinate analysis (PCoA) of Bray-Curtis index. n = 8 each, F = 2.21, R-squared = 0.14, p < 0.05, PERMANOVA.
(h) Alpha-diversity was evaluated by chao1 and Shannon index. chao1 (n = 8 each, U = 15, p = 0.08, Mann-Whitney U test), Shannon (n = 8 each, U = 19, p = 0.19, Mann-Whitney U test).
(i) Histogram of genus-level taxa with p-values <0.05 evaluated by LEfSe analysis were visualized (n = 8 each).
Mean ± SEM; ★ indicates p < 0.05; KO, knockout; WT, wild-type.
