

Abstract
Differential gene expression in response to perturbations is mediated at least in part by changes in binding of transcription factors (TFs) and other proteins at specific genomic regions. Association of these cis-regulatory elements (CREs) with their target genes is a challenging task that is essential to address many biological and mechanistic questions. Many current approaches rely on chromatin conformation capture techniques or single-cell correlational methods to establish CRE-to-gene associations. These methods can be effective but have limitations, including resolution, gaps in detectable association distances, and cost. As an alternative, we have developed DegCre, a nonparametric method that evaluates correlations between measurements of perturbation-induced differential gene expression and differential regulatory signal at CREs to score possible CRE-to-gene associations. It has several unique features, including the ability to use any type of CRE activity measurement, yield probabilistic scores for CRE-to-gene pairs, and assess CRE-to-gene pairings across a wide range of sequence distances. We apply DegCre to six data sets, each using different perturbations and containing a variety of regulatory signal measurements, including chromatin openness, histone modifications, and TF occupancy. To test their efficacy, we compare DegCre associations to Hi-C loop calls and CRISPR-validated CRE-to-gene associations, establishing good performance by DegCre that is comparable or superior to competing methods. DegCre is a novel approach to the association of CREs to genes from a perturbation-differential perspective, with strengths that are complementary to existing approaches and allow for new insights into gene regulation.
The regulation of gene expression occurs through the interaction of transcription factors (TFs) and other proteins with genomic regions, or cis-regulatory elements (CREs) (The ENCODE Project Consortium et al. 2020). Because CREs can act at considerable distances away from any given target gene, in many cases skipping over intervening genes, matching CREs to their target genes is challenging (Dixon et al. 2012; Rao et al. 2014; Javierre et al. 2016; Schoenfelder and Fraser 2019; Song et al. 2019). Such knowledge, however, is of high value for both basic and applied biology. Examples include better interpretation of how genetic variation in a CRE leads to molecular and phenotypic effect (Musunuru et al. 2010; Ulirsch et al. 2016; Song et al. 2019; van Arensbergen et al. 2019; Nasser et al. 2021) and better prediction of the effects of perturbations, such as drug treatment, on gene expression levels in a cell or tissue (Thormann et al. 2018; Carleton et al. 2020; Cholico et al. 2022).
Promoters are CREs very near to the transcription start site (TSS) of a gene and are readily associated with that gene's expression by the basic principles of transcription initiation (Myers et al. 1986; Haberle and Stark 2018). As sequence distance from the TSS increases, the association of CREs, such as enhancers, with a given gene's regulation becomes increasingly uncertain. Analysts often place a threshold on TSS-to-CRE distances under which there is putatively high confidence for the association. These thresholds range from ∼1 kb to 100 sec of kb, with little justification provided for any given choice (Wang et al. 2015; McDaniel et al. 2016; You et al. 2021; Kamal et al. 2023). It is unlikely that any single TSS-to-gene distance threshold is appropriate in all contexts, and categorical thresholds generally result in limitations to both sensitivity and specificity that impact all downstream analyses.
The maturation of chromatin conformation capture technology such as Hi-C has enabled the association of genomically distal CREs to genes through their spatial proximity in nuclei to target-gene promoters (Lieberman-Aiden et al. 2009; Rao et al. 2014; Javierre et al. 2016; Kloetgen et al. 2020; Xu et al. 2022; Meng et al. 2023). However, resource usage, especially sequencing costs, is a key limitation of these approaches. Moreover, the majority of Hi-C associations, or “loops,” span distances greater than ∼50 kb, limiting their utility to identify CRE-to-gene associations spanning shorter distances. Undoubtedly, CREs closer to TSSs harbor considerable regulatory activity, yet it is also unlikely that all CREs in this distance range are in fact relevant to the regulation of that gene, especially in response to a targeted perturbation.
Previous work by others has shown approaches to CRE-to-gene association that do not require chromatin conformation data. Many of these approaches are based on the observation that gene transcription levels and measurements of CRE regulatory activity are correlated (Ernst et al. 2011; Sheffield et al. 2013; He et al. 2014; Cao et al. 2017; Li et al. 2019). Generally, these methods generate genome-wide models of CRE activity and gene expression within a given cell type, yielding predictions for individual CRE–gene associations. Validation of these methods by comparison to chromatin capture data yielded good agreement in most cases. One possible limitation of these methods is that they may require supervised training, which could lead to underperformance when applied to untrained contexts. Also, these methods are tailored to specific types of CRE activity measurements and lack flexibility in possible inputs. Nevertheless, this work has established the ability of correlational analysis to identify true CRE-to-gene associations at various distances.
Application of correlational analyses to single-cell or single-nuclei multiomic data (RNA-seq and ATAC-seq on the same cell) can also identify CRE-to-gene associations such as methods included in the Cell Ranger ARC (10x Genomics) software or developed by others (Stuart et al. 2021). In these approaches, the correlation is generally measured across thousands of individual cells, leading to a high power to detect significant effects. Generation of these data is expensive, however, limiting its general application. Moreover, the zero-inflated nature of single-cell measurements may limit these approaches’ effectiveness, particularly to identify associations of CREs with lowly expressed genes.
Often, studies that enable the association of CREs to their target genes focus on static conditions, generating data of CRE activity and gene expression in a single context, with notable exceptions (Adamson et al. 2016; Reed et al. 2022; Xu et al. 2022). In contrast, a differential system in which two or more conditions are compared may allow for a distinct conceptual approach to CRE-to-gene association. This approach correlates gene expression and CRE activity not across genes and CREs in a single context but between the same gene and same CRE across two or more conditions resulting from one or more perturbations. Correlations in CRE activity between conditions that are concordant with gene expression changes may provide evidence of their association. Such associations would be dependent on the specific perturbation(s), perhaps limiting their generality, but also would be more informative of the perturbation's effects and potentially lead more directly to insights into the gene regulatory mechanisms at work.
We present a method, DegCre, that probabilistically associates CREs to target gene TSSs over a wide range of genomic distances. The premise of DegCre is that true CRE–to–differentially expressed gene (DEG) pairs should change in concert with one another as a result of a perturbation, such as a drug treatment or differentiation protocol. DegCre is a nonparametric method that estimates an association probability for each possible pair of differential CRE and DEG. It considers CRE–DEG distance but avoids arbitrary thresholds. Because DegCre uses rank-order statistics, it can use various types of CRE-associated data, including DNase hypersensitivity, ATAC-seq, and ChIP-seq against either histone marks or TFs. It produces significant associations with a wide range of TSS to CRE distances, up to an upper limit subject only to computational burden, with 1 Mb being quite feasible.
We apply DegCre to six distinct collections of data, including cells subject to drug treatment, gene editing, and differentiation protocols. We compare DegCre associations to Hi-C loops, CRISPR-validated links, activity by contact (ABC) scores (Nasser et al. 2021), and single-nucleus multiomic (sn-multiomic) linkage “Signac” correlations (Stuart et al. 2021). Overall, we believe DegCre to be an important advancement in the characterization and understanding of gene regulation, with ready applicability to many experiments and the ability to accurately define CRE–gene pairs in a conceptually complementary way to existing methods.
Results
DegCre operation and algorithm
The name “DegCre” was chosen to reflect that, instead of binary associations, DegCre produces association probabilities, or the “degree” to which the DEG to CRE association is likely to be true. For the purposes of this discussion, we define a DEG as a gene whose expression is potentially different between two contexts, such as before and after drug treatment or differentiation. The term “significant DEG” will mean DEGs for whom the significance of a statistical measure of expression change surpasses a defined threshold (α). The term “CRE” (cis-regulatory element) will be used to denote a genomic region with regulatory signal above the background at a chosen level. Such regulatory signals can include chromatin openness, TF occupancy, and histone post-translational modifications, among others. We understand that robustly establishing that any given genomic region is truly a CRE requires additional lines of evidence, such as targeted inhibition and activation, but will use CRE in this study to refer to any region showing condition-differential signal for the selected type of CRE measurement.
We intend for users to apply DegCre to experimental designs that consider multiple states, such as response to a perturbation, and include measurements of gene expression and regulatory signal at CREs (Fig. 1A). DegCre takes in differential gene expression measurements, defined as the P-value from comparing expression levels between conditions, along with the TSSs of those genes. DegCre also requires P-values of differential signal at CRE regions from the same conditions, such as can be generated by methods like csaw (Lun and Smyth 2016). Optimally, DegCre also uses the fold-changes of both DEG and CRE signal to measure the effect direction concordance on the assumption that increased CRE activity should correlate with increased expression and vice versa, although this is not required and for some experimental designs may not be desired. We use P-values as the primary measure of differential CRE activity rather than fold-changes to account for variable degrees of technical precision among measurements of CRE activity.
Figure 1.

Graphical overview of the DegCre algorithm. (A) DegCre requires as inputs differential P-values for CRE signal and differential gene expression (pCRE and pDEG). DegCre also needs genomic distances between CREs and TSSs (d) as input. The lightning bolt indicates a perturbation has occurred to yield the lower depiction. (B) DegCre defines all possible associations between each CRE and TSS within a specified maximum distance. (C) DegCre bins associations by their distance (d) according to a heuristic that balances resolution versus maintaining the pCRE distribution (Methods). (D) DegCre calculates a raw association probability, araw,i,j, for a given pCRE,j by finding the fraction of expected true DEGs in the set of associations in the same distance bin and with a pCRE equal to or less than (more significant) pCRE,i. Plot shows actual data from ATAC-seq at 120 min from Reed et al. (2022). (E) DegCre corrects the raw association probability if the association does not involve a true DEG. (F) For CREs with multiple associations (nearly all CREs), associations across larger genomic distances are penalized by the probabilities that the CRE is associated to nearer DEGs. (G). The false-discovery rate (FDR) of the association is calculated based on a binomial distribution that uses the bin null association probability, abin, as the success probability. Created with BioRender (https://www.biorender.com).
The DegCre algorithm begins by defining all pairwise associations between DEGs and CREs and calculating the genomic distance between each CRE and the TSSs of all DEGs within a given distance range (Methods) (Fig. 1A,B). A DegCre association is thus based on three measurements: a DEG P-value, a CRE P-value, and a genomic distance. By default, DegCre considers only possible associations within a 1-Mb range. Choosing a larger maximum distance is possible but increases the number of considered associations and the computational burden.
DegCre next bins all associations by distance (Methods) (Fig. 1C). The bin sizes are defined for each experiment such that each bin contains an equal number of associations (Methods). The goal is to define bins such that each CRE can be compared against other CREs at similar distances to yield scores for individual CRE–DEG associations that can be compared with the typical distance-normalized association; true CRE–DEG pairs should have higher signal than randomly selected CRE–DEG pairs with similar distances. To select the number of associations per bin, DegCre uses a heuristic that attempts to balance resolution (smaller bins with fewer associations) against the robustness of each bin, which is a function of the similarity of the CRE P-value distribution in each bin compared with the global CRE P-value distribution (Methods). It is important to maintain uniformity of the bin-wise CRE P-value distribution because subsequent calculations rely on CRE P-value rank order within the bin. Thus, if bins are too small and harbor only highly significant or only insignificant P-values, then true pairs cannot be distinguished from the background. In contrast, if bins are too large, the distance normalization becomes irrelevant as distances with biologically very different priors (in terms of likelihood for a random association to represent a real association) are conflated.
For each bin, DegCre calculates raw association probabilities, represented by “a” in the figures and formulas to avoid confusion with significance probabilities (Fig. 1D). For a given association with a given CRE P-value, DegCre finds all associations within the same bin that have a CRE P-value with equal or greater significance (Methods). DegCre then calculates the expected number of true DEGs within that set of associations and divides it by the set size to obtain a true DEG fraction (Methods) (Fig. 1D). We call this value the raw association probability, araw, an estimation of the probability the association connects a CRE to the change in expression of a target gene. This calculation araw is determined by association distance, CRE P-value, and DEG P-value and makes no assumptions of the underlying distributions of those inputs.
Although there is a unique araw value for each unique CRE P-value, araw values essentially represent a set-level probability, as they reflect the cumulative probability of all associations with that degree of CRE significance or greater. DegCre therefore corrects araw by the probability that an association involves any given significant DEG to generate acorr (Fig. 1E). DegCre applies this correction to associations with adjusted DEG P-values passing a selected α (Methods). The choice of the DEG α is an important parameter and can be guided by an included optimization function (Methods). A given CRE will generally have associations to multiple significant DEGs. All else being equal, we assume that the association most likely to be real is to the nearest DEG. DegCre thus considers all significant DEG associations for a given CRE and reduces a given acorr weighted by the acorr values of associations containing that CRE that have shorter association distances (Methods), producing the final reported association probability (Fig. 1F). This process can and often does produce multiple significant associations to different DEGs for any given CRE.
For false-discovery rate (FDR) estimation of the association probability, DegCre considers the raw association probability of each bin without regard to CRE P-value, abin (Fig. 1D). The abin value depends on distance-based binning only (i.e., it reflects the scores derived from all possible CREs within a given distance range), and we consider it to be a suitable null hypothesis for the effect of CRE P-values on association probabilities. Accordingly, DegCre calculates an association probability FDR based on the binomial cumulative distribution function using abin as the trial success probability (Methods) (Fig. 1G).
DegCre is implemented as an open-source R package (Methods). It operates within the GenomicRanges (Lawrence et al. 2013) framework. It includes functions for secondary calculations, visualization of results, and conversion of the results into other formats.
Data sets for the demonstration of DegCre analysis
DegCre operates on measurements of gene expression and signal at CREs in response to a perturbation to generate association probabilities between genes and CREs. We therefore sought to test DegCre using data sets from perturbation experiments, including examples from using drug treatment, differentiation protocols, and mutational altering of a TF.
We selected six data sets that show DegCre's functionality on a variety of input types. Two data sets (Savic et al. 2016; McDowell et al. 2018) derive from experiments that use activation of a nuclear receptor (Han et al. 2017; Vettorazzi et al. 2022) using a well-studied drug with samples collected at various posttreatment time points. Another data set (Reed et al. 2022) consists of time course samples from macrophage activation following stimulation (Schneider et al. 2014). A fourth data set (Hiatt et al. 2023) includes data from cells edited to harbor both deleterious and benign mutations in the TF ZMYM3 (Hu et al. 2017). A fifth data set (Sanchez-Priego et al. 2022) comprises samples from a human model of neuronal firing collected at two time points. Finally, the last set (Rogers et al. 2024) is single-nucleus multiomic data from neural progenitor cells subjected to neuronal differentiation (Bardy et al. 2015) collected at three time points. More detailed information for each of these data sets is provided in Supplemental Table 1.
All data sets include RNA-seq, enabling differential expression analysis. Each data set includes various measures of CRE activity, with four having measures of open chromatin (ATAC-seq or DNase hypersensitivity) and another four with ChIP-seq of acetylation of histone H3 at lysine 27 (H3K27ac). Other CRE activity data types included within at least one of these data sets are ChIP-seq of mono- and trimethylation of histone H3 at lysine 4 (H3K4me1 and H3K4me3) and individual TFs. The Hiatt et al. data includes ChIP-seq via an antibody to a FLAG tag introduced into ZMYM3 via genome editing (Savic et al. 2015; Hiatt et al. 2023). More information on the included data types is presented in Supplemental Table 1. All data are publicly available with accessions provided in Supplemental Data 1.
For the ChIP-seq, ATAC-seq, and DNase hypersensitivity data, we aligned raw reads to hg38 when necessary or used investigator-supplied BAM files. We then applied the R package csaw (Lun and Smyth 2016) to generate regions of differential signal as GRanges objects (Methods). For RNA-seq, we used investigator-provided counts and determined differential expression between treatments and time points using DESeq2 (Methods). We associated the differential expression results with gene TSSs as defined in the EPDnew database (Dreos et al. 2015; Meylan et al. 2020) and created GRanges objects (Methods).
Characteristics of DegCre associations
We applied DegCre analysis to each of the data sets described above, which take at most a few minutes on a regular desktop computer using default settings, including measuring CRE-to-gene (where the location of the gene is defined to be its promoter) pairings up to 1 Mb of distance (Methods) (Supplemental Data 2). The total number of associations passing an FDR threshold (by default set to 0.05) varies across each data set from dozens to tens of thousands (Supplemental Fig. 1A). The total number of significant DEGs largely determines the number of significant DegCre associations (Methods) (Supplemental Table 2); that is, experiments with more DEGs yield more DEG–CRE pairs (Supplemental Fig. 1B), because only associations involving a significant DEG can potentially pass any given FDR threshold (Methods). The total number of CREs with nominally significant differential signal P-values has less effect on the total number of significant DegCre associations (Supplemental Fig. 1C).
The number of significant associations generally decreases with increasing genomic distance between DEG TSSs and CREs (Fig. 2A; Supplemental Figs. 2–9). Although this likely reflects real biology, this distance dependence also reflects the fact that DegCre weights equivalently significant associations for a given single CRE in favor of the ones spanning shorter genomic distance (Methods). Thus, longer associations are likely to pass FDR correction only if there are no other shorter associations of equal or greater strength involving that CRE. Associations from some data types from McDowell et al. display a slower decrease versus distance compared with others (Supplemental Fig. 3). For example, associations from ChIP-seq from H3K4me3 show a much steeper decrease compared with those from H3K4me1 or EP300. This observation is consistent with the known binding profiles of these factors, as H3K4me3 is primarily associated with promoters and promoter-proximal CREs, whereas H3K4me1 and EP300 are primarily associated with enhancers and other distal CREs (Visel et al. 2009; The ENCODE Project Consortium et al. 2020).
Figure 2.

Characteristics of DegCre associations. (A) The black line in the upper panel half displays the number of DegCre associations per bin that pass FDR less than 0.05. The bottom panel displays the per bin DegCre association probability. The common x-axis shows for each bin the association distance from TSS to CRE. Each bin comprises a range of distances with the upper bound of that range plotted here. The black line indicates the median value for each bin, and the blue region indicates the interquartile range (IQR). The red line shows the per bin probability considering only the bin distance, used as the null in the DegCre FDR calculation (Methods). DegCre associations are shown from the ATAC-seq data at 2 h from Reed et al. (B–G) Bars show the counts or fractions of ENCODE cCRE annotation overlaps for tested CREs having at least one significant (FDR less than 0.05) DegCre association. (B) Fractions are from McDowell et al. at 8 h for the indicated data types. (C) Fractions are shown for H3K27ac ChIP-seq data from McDowell et al. at 8 h, Reed et al. at 2 h, Savic et al. at 24 h, and Sanchez-Priego et al. (Cut and Run) from the H1 GABA late time point. (D) Counts for ZMYM3 CETCh-seq (discordant associations) from Hiatt et al. R1274W is a likely pathogenic mutation, and R688H is likely benign. (E–G) Counts of associations by time point are shown for ATAC-seq data from Reed et al. (E), ATAC-seq data from Sanchez-Priego et al. (F), and NR3C1 ChIP-seq data from McDowell et al. (G). Abbreviations for ENCODE cCREs are as follows: (PLS) promoter like sequence, (pELS) proximal enhancer-like sequence, and (dELS) distal enhancer like sequence.
The values of the association probabilities passing the FDR threshold vary from just above the null probability for a given bin (Fig. 2A, red lines in bottom panel; Supplemental Figs. 2–9) to higher values closer to 100% (Fig. 2A, interquartile ranges shown in bottom panel; Supplemental Figs. 2–9). These ranges illustrate a key characteristic of DegCre associations. The DegCre FDR estimates whether the association probability exceeds the null, bin-wide probability owing to the input of the differential CRE signal. However, those associations that pass a chosen FDR threshold can still be further stratified by the association probability itself. For example, we infer, to a reasonable approximation, that a DegCre association with a probability of 0.9 will be three times more likely to confirm in an orthogonal assay compared with one with 0.3, with both passing a chosen FDR threshold.
DegCre is agnostic to the methods of assigning differential CRE significance P-values to genomic regions. For these data, we used csaw with defined windows (20 bp for TFs, 200 bp for histone marks and open chromatin signals) spanning hg38 to assess the level of differential signal between conditions for each type of CRE measurement (Methods). We did not use peak calling for any CRE data set; that is, we considered all sites with evidence for differential CRE signal between two conditions to be a CRE with the potential to correlate with nearby DEGs, whether or not that CRE would be called a “peak” in either or both of the conditions. A possible concern with this processing strategy is that it could lead to DegCre associations involving CREs of dubious regulatory potential. Accordingly, for all data sets, we intersected ENCODE-defined cCRE annotations (The ENCODE Project Consortium et al. 2020) with all CREs predicted by DegCre to target a DEG with an FDR of less than 0.05 (Fig. 2B–G; Supplemental Figs. 10, 11). The overlap rate was high and largely in proportion to the occurrence of the annotation types in the ENCODE set, except for promoter-specific (H3K4me3, JUN, BCL3) or enhancer-specific (H3K4me1, EP300, NR3C1, CEBPB) data types (Fig. 2B). DegCre associations based on H3K27ac, which marks both promoters and enhancers, have varying proportions of ENCODE annotations, likely reflecting perturbation-specific differences (Fig. 2C). Thus, DegCre finds associations involving credible regulatory regions with biases toward various CRE types attributable to the nature of the CRE measurement data.
In Hiatt et al. (2023), the target of the experiment is ZMYM3, a TF that they showed to associate with an X-linked neurodevelopmental disorder and that had been previously proposed to have repressive effects on gene transcription (Hu et al. 2017). Accordingly, we generated DegCre associations three ways: requiring effect direction concordance between DEG and CRE changes (i.e., increased expression only paired with increased ZMYM3 ChIP-seq signal), requiring anticorrelation of effect directions, or allowing both types. We found more significant associations when requiring anticorrelation, consistent with a repressive role (Fig. 2D; Supplemental Fig. 11A). Also included in this set was a likely benign mutation in ZMYM3 (R688H). DegCre analysis of these data produced very few associations (Fig. 2D), showing reasonable handling of null data (i.e., genome-wide CRE measurements that are unlikely to be relevant to differential gene expression) by DegCre.
We also note that, within the experiments spanning multiple time points, the total number of significant DegCre associations either consistently increases or increases and plateaus with time after perturbation for all data sets. However, the relative fraction of ENCODE annotations tended to remain stable over time (Fig. 2E–G; Supplemental Figs. 1, 10, and 11). This time dependence may arise from the accumulation of secondary gene regulation that occurs after perturbation. Regardless, the time elapsed from the perturbation does not appear to affect the types of ENCODE cCREs involved in DegCre associations.
Comparison of DegCre associations to Hi-C loops
We sought to compare DegCre associations to Hi-C-derived loop calls from Reed et al. (2022), generated using Sip (Rowley et al. 2020) at an FDR < 0.05. We used liftOver (Lawrence et al. 2009) to convert these loops to hg38 coordinates (Methods).
We excluded 18 hg38 loops with loop sizes (defined as genomic distance from anchor-to-anchor midpoints) smaller than 30 kb after liftOver because all loop sizes were ≥30 kb before liftOver. The remaining loops spanned up to 28,617,181 bp with a median size of 390,000 bp (Supplemental Fig. 12A). Significant (FDR ≤ 0.05) DegCre association distances derived from both ATAC-seq and H3K27ac ChIP-seq data from Reed et al. are mostly shorter than Hi-C loops, especially at time points past 30 min (Supplemental Fig. 12B–D), occurring at distances down to zero (i.e., at the TSS itself). Also, we set the maximum DegCre association distance to 1 Mb owing to the increased computational burden at higher maximum distances. Accordingly, to evaluate the overlap of these two measures of CRE associations to DEGs, we considered only DegCre associations and Hi-C loops in the distance range of 30 kb to 1 Mb.
By design, significant DegCre associations can occur only between significantly expressed DEGs and CREs, as marked by the input assay (here ATAC-seq and H3K27ac ChIP-seq; see Methods); that is, if a gene is not differentially expressed between conditions or if a CRE does not show differential activity, there will be no DegCre association prediction. To compare DegCre associations to Hi-C loops, we thus considered only Hi-C loops with one anchor overlapping a CRE with a significant DegCre association. For both ATAC-seq and H3K27ac ChIP-seq, approximately one-third of the Hi-C loops met this criterion (Supplemental Fig. 13, cf. A and B). For Hi-C loops that do overlap a DegCre association CRE, we placed each Hi-C loop into one of four categories: (1) it overlaps the TSS of the same gene that the DegCre association does (Fig. 3A); (2) it overlaps the TSS of a different gene than the DegCre association, and that different gene is also significantly differentially expressed (Fig. 3B); (3) it overlaps the TSS of a different gene than the DegCre association, and that different gene is not significantly differentially expressed; and (4) it does not overlap the TSS of a gene. We found that most Hi-C loops fall into the last two categories (Supplemental Fig. 13, cf. C and D). These loops are difficult to interpret in comparison to DegCre associations. They associate CREs to regions that DegCre does not consider, including sites that are not TSSs (such as distal CREs) or that are TSSs of non-DEGs. Either category cannot be compared with DegCre associations. Accordingly, we considered only the first two categories further.
Figure 3.

Comparison of DegCre associations to Hi-C loops. (A) For ATAC-seq data from Reed et al. at the 120-min time point, DegCre associations with an FDR ≤ 0.05 and an association distance >20 kb are shown in black. Hi-C loops with an FDR ≤ 0.05 and a loop distance <1 Mb are shown in light red. Gene names in black indicate significant differential expression. Black arrows indicate distal CREs that both DegCre and Hi-C link to the VCAM1 TSS. The signal track (yellow) shows the −log10 of the differential ATAC signal multiplied by the sign of the log fold-change. (B) Same plotting conventions as A but the black arrow indicates a group of CREs for which DegCre and Hi-C assign the TSSs of different significant DEGs. (C) For ATAC-seq data, the blue bars indicate the number of Hi-C loops that have one anchor in a CRE with a significant (FDR < 0.05) DegCre association and that link to the TSS of the same DEG as the DegCre association. Red bars indicate the number of Hi-C loops that have one anchor in a CRE with a significant DegCre association and that link to the TSS of a different DEG from the DegCre association. (D) Same plotting conventions as C but for H3K27ac ChIP-seq data.
Comparing the partitioning of the Hi-C loops into these first two categories across all time points and both CRE-defining data types, ATAC-seq and H3K27ac ChIP-seq, we found that more DegCre associations and Hi-C loops associate with the same significant DEG than with different significant DEGs (Fig. 3C,D). This effect is greater at earlier time points, likely indicating the higher ability of DegCre to properly assign distal CREs to DEGs when considering earlier gene expression changes that are more likely to reflect a primary regulatory effect of the perturbation.
DegCre performance on CRISPR-validated associations
A powerful technique for evaluating CRE function is through editing or repressing the activity of these regions with CRISPR-Cas9 sequence alteration or CRISPR interference (CRISPRi) (Gasperini et al. 2019; Nasser et al. 2021; Nuñez et al. 2021). To that end, we obtained a compilation of CRISPR and CRISPRi perturbations of genomic loci and corresponding gene expression measurements from Nasser et al. (2021). After liftOver to hg38 coordinates, there were 5685 gene to distal CRE (>500-bp) associations, involving 1913 unique CREs. We also obtained a second set of CRISPRi perturbations from Gasperini et al. (2019) consisting of 47,222 associations (including multiple gRNAs per region and having an empirical adjusted P-value) involving 5920 unique regions.
Again, DegCre aims to find associations between genomic regions and DEGs with significant changes in response to a perturbation. Accordingly, we filtered all DegCre associations to those containing a significant DEG. Much of the CRISPR validation data sets include associations that do not validate by CRISPR. For these comparisons, we thus retained all DegCre associations involving a significant DEG regardless of FDR level so that both low- and high-scoring DegCre predictions can agree or disagree with CRISPR results.
Nasser et al. (2021) classified each CRE-to-gene association as “regulated” or “not” based upon the CRISPR data, and we used this as ground truth, resulting in 281 true associations. For Gasperini et al. data, we considered each CRE-to-gene association at the guide RNA level to be true if the gene's change had an empirical adjusted P-value (as calculated by the investigators) ≤0.1 (effectively equivalent to a 10% FDR), resulting in 1307 true associations. We overlapped the filtered DegCre associations to the CRISPR association data, finding various degrees of overlap for each data set and type (Supplemental Data 3, 4).
We also sought to compare DegCre's performance against CRISPR validation data with that of competing models. The Nasser et al. data also includes ABC scores for each experimentally tested association. ABC scores are based on gene expression, chromatin openness, H3K27ac, and Hi-C data from static conditions (Fulco et al. 2019). For a second comparator model, we simply assigned each CRE to the nearest significant DEG within 1 Mb, referring to this model as “nearest.” The predictor score of the associations in this model is the negative base-10 log of the CRE differential P-value. Only the Nasser et al. associations have ABC scores, whereas the “nearest” model can be evaluated against both CRISPR validation sets.
We evaluated the performance of all models against both CRISPR data sets using precision-recall (PR) curves and calculated the area under the curve (AUC). Against the Nasser et al. data, DegCre performed well above “zero-skill” (random chance) and yielded a performance comparable to ABC scores across several of the tested data sets (Fig. 4A–D; Supplemental Fig. 14; Supplemental Data 3). For comparing PR AUCs, we only considered data that overlapped with at least 25 positive (“regulated”) associations because lower degrees of overlap resulted in poorly defined PR curves, leading to 12 passing data sets. DegCre associations had higher PR AUCs that the “nearest” model in all cases in these data (Fig. 4A–D; Supplemental Fig. 14; Supplemental Data 3), showing superior performance relative to this simple model.
Figure 4.

Evaluation of DegCre associations with CRISPR perturbations. (A–C) Precision-recall (PR) plots are presented with CRISPR data from Nasser et al. as the standard. (PPV) Positive predictive value (precision), (TPR) true-positive rate (recall). Dashed red line indicates “zero skill” performance. Predictions based on DegCre and ABC are shown in the indicated colors. A model in which a CRE is assigned to the nearest DEG (passing adjusted P-value cutoff), “nearest,” is shown in gray. DegCre and nearest predictions are based on data from Reed et al. H3K27ac ChIP-seq at 2 h (A), Savic et al. H3K27ac ChIP-seq at 48 h (B), and Reed et al. ATAC-seq at 2 h (C). (D) PR areas under curve (AUCs) are shown for each method for all data sets with greater than or equal to 25 associations positive by CRISPR. (E–G) PR plots are presented with CRISPR data from Gasperini et al. as the standard with same conventions as A–C. Predictions are based on data from Reed et al. H3K27ac ChIP-seq at 2 h (E), Sanchez-Priego et al. H3K27ac Cut and Run from H1 GABA late (F), and Hiatt et al. ZMYM3 CETCh-seq with R1274W variant using anticorrelated analysis (G). (H) Same as D but for Gasperini et al. data.
We also compared DegCre and “nearest” associations to the Gasperini et al. CRISPR data, again finding that DegCre performance exceeded random chance and was superior to “nearest” in all passing data sets (Figs. 4E–H; Supplemental Fig. 15; Supplemental Data 4). The Gasperini et al. data set is much larger than that of Nasser et al., leading to 22 (vs. 12) data sets passing the 25 positive association cutoff. Overall, the PR AUCs are lower for the Gasperini et al. data set versus Nasser et al. data set, perhaps reflecting the choice of Gasperini et al. to focus their study on more distal candidate enhancer regions, for which the prediction of associations is more challenging. Nevertheless, the evaluation of DegCre associations against two distinct CRISPR data sets shows good performance of DegCre, with comparable results to ABC and clear superiority to a “nearest” DEG model.
Comparison of DegCre to single-nucleus multiomic linkages
In single-cell and single-nucleus multiomics, one can measure RNA expression and chromatin accessibility from the same individual cells (or nuclei), enabling correlational analyses across all measured cells (generally thousands). Regions with chromatin accessibility that is correlated with nearby genes’ expression may be driving those expression changes and suggest a CRE-to-gene association. The degree of this cross-cell correlation provides a quantitative measure of the association strength. Methods such as those included in the Cell Ranger ARC software from 10x Genomics, Signac, and SnapATAC (Fang et al. 2021; Stuart et al. 2021) operate on multiomic data and generate such associations. We selected Signac associations to benchmark DegCre associations.
As input to both DegCre and Signac, we used data generated in our laboratory that was previously published (Rogers et al. 2024). The data were derived from neural progenitor cells subject to differentiation (Bardy et al. 2015) to neurons and sampled at days zero, 14, and 21 relative to the beginning of the differentiation protocol (Rogers et al. 2024). UMAP clustering of the sn-multiomic data resulted in three clusters, roughly corresponding to these time points (Fig. 5A). To enable DegCre analysis, we pseudobulked the sn-RNA-seq and sn-ATAC-seq by cluster membership and made three pseudoreplicates for each cluster (Methods). We ran DegCre with the three pair-wise cluster comparisons as the condition effect. We then ran Signac analyses on cells from the clusters in each comparison. For example, DegCre associations from cluster 3 versus cluster 2 are comparable to Signac associations from cells with membership in clusters 3 and 2. Signac does not consider association distance, and we chose 500 kb as the CRE-to-gene cutoff for comparison of the DegCre and Signac associations.
Figure 5.
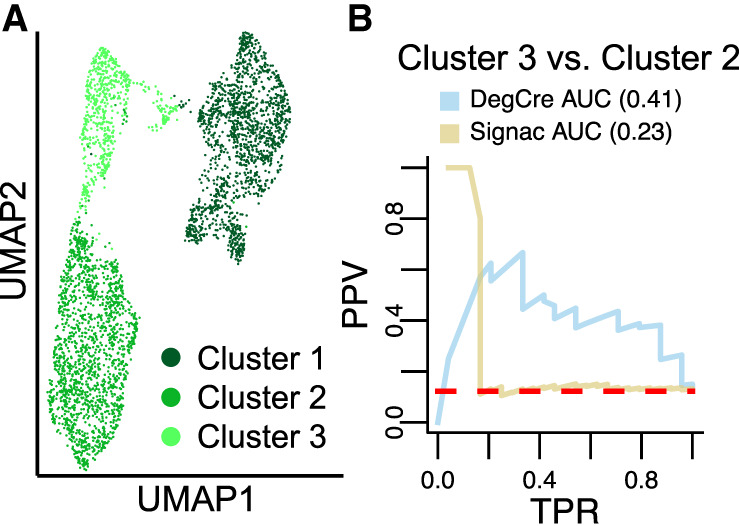
Comparison of DegCre associations from single-nucleus multiomics to Signac. (A) UMAP representation of single-nucleus RNA-seq and ATAC-seq from neuronal precursor cell differentiation time course from Rogers et al. (B) PR curve using Gasperini et al. CRISPR data as the standard. (PPV) Positive predictive value (precision), (TPR) true-positive rate (recall). Dashed red line indicates “zero skill” performance. DegCre associations were calculated on pseudobulked RNA and ATAC data. Signac (Stuart et al.) was applied to single-nucleus data to generate linkage scores.
DegCre and Signac scores of overlapping associations are weakly but significantly positively correlated (Spearman's ρ = 0.105) (Supplemental Fig. 16). We compared each to the Gasperini et al. CRISPR data to evaluate their performance on validated associations and found that the DegCre associations had a much higher PR AUC than that of the Signac associations (Fig. 5B; Supplemental Fig. 17; Supplemental Data 5). For the highest-scoring subset of associations based on clusters 3 and 2, Signac has nearly perfect performance that drops at a TPR of ∼0.2 (Fig. 5B). We speculate that Signac performs well on associations across shorter genomic distances, but that performance tapers off at an underdetermined threshold. Nevertheless, DegCre performs well across a much broader portion of the data set, likely benefitting from a better handling of association distance. Signac associations based on clusters 1 and 2 and on clusters 1 and 3 did not perform better than random chance (Supplemental Fig. 17; Supplemental Data 5). This underperformance is likely driven by data quality because cluster 1 had fewer ATAC peaks called per cell and total ATAC reads. However, DegCre on pseudobulked data overcame these quality issues, yielding high PR AUCs compared with the Gasperini et al. CRISPR data on cluster 1–cluster 2 and cluster 1–cluster 3 comparisons (Supplemental Fig. 17; Supplemental Data 5).
Prioritization of target genes with DegCre
A key goal of perturbation studies is often to identify the direct target genes among a set of significant DEGs. For perturbations that involve the activation of TFs, such as the introduction of ligands to nuclear receptors, “direct targets” mean those genes with expression changes that are mechanistically attributable to a change in the genomic occupancy of the nuclear receptor at a CRE that regulates that gene. Identification of direct target genes is desirable because it can lead to insight into the perturbation's mechanism of action, and it may increase the extensibility of the observed experimental results to other systems.
As DegCre outputs probabilistic scores, it can calculate the expected number of truly associated CREs for each DEG. For a given gene, this is simply the sum of its association probabilities passing a specified FDR cutoff, resulting in an estimation of the number of associated differential CREs that would pass validation (e.g., for a DEG with 10 FDR-passing associations averaging 20% association probability, it would be expected that there are two true CRE–DEG pairs). Thus, genes with many expected associations are more likely to be confidently linked to a driving regulatory signal. We calculated the expected associations per significant DEG for all the tested data sets (Fig. 6A; Supplemental Figs. 18, 19). The distributions of expected associations per DEG generally showed a slight increase with time followed by a plateau or decrease.
Figure 6.

Identification of dexamethasone target genes with DegCre. (A) The boxplot shows the distribution of expected DegCre associations per significant DEG (FDR ≤ 0.05) based on NR3C1 ChIP-seq data from McDowell et al. The black line shows the median expected DegCre associations per DEG. The cyan points show values for ERRFI1. (B) The volcano plot shows the −log10 of the adjusted (Bonferroni) differential expression P-value versus the log2 fold-change. Blue dots indicate genes whose expected number of associations is in the top 100 of all significant DEGs. (C) The browser view shows DegCre associations (top panel) and NR3C1 ChIP-seq signal at 4 h for an established glucocorticoid pathway target gene, ERRFI1. The NR3C1 signal is plotted as –log10 of the differential P-value multiplied by the sign of the log fold-change. Regions of NR3C1 signal have been merged in some cases for better visibility at browser scale.
We further considered the DegCre results derived from NR3C1 (commonly referred to as the glucocorticoid receptor) ChIP-seq in the McDowell et al. data. In these experiments, cells were treated with dexamethasone, a potent agonist of NR3C1. We looked at the subset of DEGs at 4 h after treatment that had the top 100 most expected associations with NR3C1 CREs (Fig. 6B). This subset differs from what one would obtain by ranking DEGs by differential expression significance or fold-change magnitude alone, indicating that the DegCre-derived expected CRE associations per DEG adds additional, complementary information. ERRFI1, a well-established and ubiquitous target of NR3C1 (Juszczak and Stankiewicz 2018), shows significant but relatively moderate fold-change (3.4-fold) in expression after NR3C1 stimulation (Fig. 5B). However, ERRFI1 ranks highly across all time points by expected associations per DEG (Fig. 5A) owing to the numerous regions of concordant differential NR3C1 occupancy associated to its expression by DegCre (Fig. 6C).
Discussion
DegCre represents a valuable advancement toward the fundamental goal of associating regulatory regions with gene expression. DegCre uses differential effects between conditions to identify regulatory regions specific to the causative perturbation. The probabilistic associations produced by DegCre span a wide range of interaction distances and enable the implementation of new analyses.
DegCre makes no parametric assumptions about the distribution of the input CRE and DEG P-values and thus has flexibility to accommodate a wide variety of data types. We noticed that the CRE P-values we produced from csaw analysis deviated somewhat from a uniform distribution, with a high degree of “one” inflation (i.e., regions that show no differential signal). Because DegCre essentially uses the rank of these values, such unexpected distributions are not problematic. DegCre does not threshold by association distance or CRE P-value, avoiding issues that may arise from such practice.
We evaluated the validity of the DegCre associations by comparison with two orthogonal data types. First, we compared DegCre associations to Hi-C loops derived from the same cells (Fig. 3). We initially conceived DegCre to primarily perform well for CREs proximal to DEG TSSs (e.g., within tens of kb). However, our comparison to the Hi-C loop calls indicated that DegCre can produce high-quality associations at distances at least up to 1 Mb, particularly at early time points, which are likely enriched for primary, direct CRE–DEG effects (Fig. 3C,D). However, in cases in which a CRE is near the TSSs of two significant DEGs, DegCre will generally assign it to the most proximal TSS, at times in conflict with Hi-C loops (Fig. 3B). However, because Hi-C loops spanning short distances are rarer (Supplemental Fig. 12A), the shorter DegCre association in Figure 3B may still be valid even if the failure to call the longer Hi-C-inferred association is likely a false negative (i.e., false-negative loop calls, especially at shorter distances, are a possible explanation for such discrepancies). As such, we believe DegCre provides valuable, complementary information to Hi-C and related assays.
We also compared DegCre to CRISPR validated associations from Nasser et al. and Gasperini et al. data. Nasser et al. (2021) benchmarked various enhancer-to-promoter association methods, including their own, ABC. Gasperini et al. (2019) sought to identify characteristics of validated enhancers in a cell type with abundant available data, K562. As such, they were not specifically selected to be relevant to the perturbations and cell types used in our assessments of DegCre. Very few of these Nasser et al. CRISPR-tested associations overlapped with DegCre associations derived from the McDowell et al., Hiatt et al., and Sanchez-Priego et al. data sets (Supplemental Data 3, 4), suggesting the CRE or gene targets of these perturbations are not well represented in this CRISPR data set. The Nasser et al. CRISPR data overlapped well with the Reed et al. and Savic et al. DegCre associations, yielding good performance (Fig. 4A–D; Supplemental Fig. 14; Supplemental Data 3). The larger Gasperini et al. data set yielded much better overlaps with the DegCre associations across all input data sets (Supplemental Data 4). Again, DegCre associations performed well, greatly exceeding random chance (Fig. 4E–G; Supplemental Fig. 15; Supplemental Data 4). The high performance of DegCre associations benchmarked to two separate CRIPSR validation sets is compelling evidence of its utility in characterizing gene regulation mechanisms in response to perturbations.
We compared DegCre associations to three alternative methods: ABC, “nearest DEG,” and Signac linkage from sn-multiomics. The creators of ABC have shown its superior performance to most other approaches for connecting enhancers to promoters in static (i.e., nonperturbation) experimental contexts (Nasser et al. 2021). Although relative performance varied across experiments and input types, DegCre overall performed somewhat lower than, but comparable to, ABC in regions of overlap (Fig. 4A–D; Supplemental Fig. 14; Supplemental Data 3). The similar performance of DegCre to ABC in areas of predictive overlap thus strengthens the validity of DegCre associations. A “nearest DEG” model represents an easy-to-implement method that is often used. Although “nearest DEG” performed well above random chance in certain data sets, it was always surpassed by DegCre. Considering that DegCre is also easy to implement and runs quickly, we believe it to be a better option. Signac linkages called on sn-multiomics from Rogers et al. only performed well on a small subset of associations, whereas DegCre performed well across the set (Fig. 5B). We believe this to be largely driven by association distance. Signac may perform better with a shortened CRE-to-gene distance threshold, but this would also limit its utility. Signac was also likely affected by low data quality that was overcome by pseudobulking and DegCre analysis (Supplemental Fig. 17). The demonstration of DegCre's strong performance on the sn-multiomic data make it an attractive option for multiomic experimental designs in which grouped comparisons are meaningful.
Direct enhancer-to-promoter loop calling and ABC both rely on Hi-C or related assays. Implementation of Hi-C remains resource intensive, prohibiting its use in a variety of cell types and conditions. Also, the resolution of Hi-C loop calls (size of the anchor regions) also depends on the sequencing depth (Rowley et al. 2020), such that high-resolution loop calls require even further resource expenditure. The investigators of ABC assert that it can generate good predictions with an available generic Hi-C data set as input. However, this remains to be tested on a wide diversity of cell types. DegCre's independence from Hi-C inputs greatly reduces the barrier to identify CRE-to-gene associations.
We use a penalty to CREs with multiple associations that favors the most proximal (Methods). This choice is supported by observations by Nasser et al. (2021) and those presented here (Fig. 4A–D; Supplemental Fig. 14; Supplemental Data 3) showing that a “nearest DEG” model performs reasonably well in many cases. Also, we believe this high performance is likely increased at the relatively short CRE-to-TSS distances observed for many high-confidence DegCre associations (Fig. 2A–C). However, there are clearly examples of a single CRE regulating several distal genes, such as the hemoglobin subunit beta LCR (Grosveld et al. 1987). DegCre will likely underpredict associations for such loci, a limitation of this approach.
With default settings, DegCre uses log fold-changes to require concordance between CRE and DEG effect directions (both up or both down), although this requirement can be removed. For repressors, a more suitable approach is to require opposite directions, as shown in the Hiatt et al. data set (Fig. 4G; Supplemental Data 4). However, for CRE signals that are thought to lead to both directions within a given experiment (i.e., measurement of a TF that represses some targets and activates others), one should probably not require effect direction concordance. This may change DegCre performance, and we have not tested this scenario.
In its current implementation, although DegCre can use many different types of CRE measurement as input, it accepts only one at a time; consideration of multiple CRE inputs requires multiple independent runs of DegCre. We ultimately envision an implementation that accepts multiple CRE signals simultaneously and produces a composite association probability. Different CRE inputs are likely to have varying degrees of correlation, making their integration more challenging. Also, different CRE inputs will likely occur at nonoverlapping genomic regions in some cases, further complicating the amalgamation of the signal. We are currently working on ways to overcome these challenges and create a multivariate version of DegCre.
To facilitate a clear presentation, we chose to use P-values derived from differential expression or differential CRE signal analyses using simple models. For example, we compared time zero separately to each successive time point. However, both csaw and DESeq2, as well as other similar methods, can use more complex regression models involving continuous variables and several covariates. We anticipate that DegCre will be applicable to experimental designs with more complex regression analyses, such as drug treatment of a panel of patient-derived cell lines in which numerous covariates would require consideration.
We have presented DegCre, an algorithm for the probabilistic association of CREs with DEGs in response to perturbations. As a freely available R package, DegCre produces convenient data structures and runs efficiently on large data inputs. We showed its application to six distinct published data sets, each involving different perturbations, cell contexts, and regulatory signal measurements. From these, DegCre produced associations involving established regulatory regions that are confirmed by Hi-C and CRISPR validation, yielding associations that identify direct target genes of the perturbations. DegCre complements existing approaches by providing probabilistic scores for CRE-to-gene associations at a wide range of biologically relevant distances, using less-resource-intensive, and thus more broadly obtainable, input data. We believe that DegCre is an important tool for the systematic and quantitative characterization of differential gene regulation.
Methods
DegCre package and algorithm
Documentation of DegCre and included functions is provided in the package manual. It operates within the GenomicRanges (Lawrence et al. 2013) framework, accepting GRanges objects as inputs and returning a hits object with results as metadata. It includes functions for secondary calculations, visualization of results, and conversion to other formats. We ran DegCre using R version 4.2.1 (R Core Team 2022).
DegCre uses functionality within the GenomicRanges package to create overlaps and the associated distances between supplied TSS and CRE GRanges inputs. Next, DegCre bins the associations by TSS to CRE distance. The bin containing the longest associations is larger than the other bins to accommodate the remainder that occurs when the total number of associations is not an integer multiple of the number of bins. DegCre next attempts to balance high resolution (many bins with fewer associations) versus the minimization of the per bin CRE P-value distribution deviation from the global (unbinned) distribution. For an array of potential bin sizes (number of associations per bin), DegCre calculates the median Kolmogorov–Smirnov (KS) test statistic across all binned CRE P-value distributions versus the global distribution. The use of the median KS test statistic enforces a degree of global uniformity but allows for some individual distance bins to diverge from the global distribution. DegCre picks the smallest bin size (containing the fewest associations per bin) that is less than a user-specified fraction (defaults to 0.2) of the range from the lowest to highest median KS test statistic (Supplemental Fig. 12). We chose this fraction threshold because it often occurred near an inflection point in the curve (Supplemental Fig. 20).
DegCre generates association probabilities by considering the rank order of the significance in the CRE signal change and binarizing DEG differential expression with a significance cutoff. Although DegCre is measuring pairwise correlations between DEGs and CREs, this asymmetric treatment in some sense assumes a flow of information from CRE to DEG. We believe this is justified because it mirrors the expected causal nature of changes to CRE activity leading to changes in gene expression, discovery of which is the analytical purpose of DegCre.
The first step in calculating the raw association probability for a given association between a single DEG i and a single CRE j, araw,i,j, considers the set of associations within the same distance bin that have CRE P-values as or more significant than pCRE,j (Fig. 1A,D), which we denote as Ai,j,. We calculate the expected number of true DEGs, EDEG, in this set by using the following equation:
where α equals the chosen significance threshold of the adjusted DEG P-values, and n equals the number passing the threshold. The equation is only valid with Bonferroni adjusted P-values (Finner and Roters 2002). To generate araw,i,j, one divides EDEG by the size of set Ai,j:
Thus, araw,i,j is the fraction of true DEGs within the set Ai,j. Although this is a set-level metric, every unique pCRE,j in each distance bin generates a unique araw,i,j. For the considered association itself, we obtain a corrected probability acorr,ij, by setting the probability at zero if the adjusted DEG P-value is greater than α, because it cannot be an association between a CRE and a “true DEG” (Fig. 1E). If the adjusted DEG P-value is less than or equal to α, no correction is made. This process often results in multiple associations per DEG.
A given CRE will often have associations to multiple genes (Fig. 1F). We favor the more proximal associations by down-weighting more distal associations in proportion to the sum of the more proximal. The final association probability a, is derived by
where D is the maximum association distance of the bin to which a given association belongs. Associations from the same CRE to different DEGs in the same distance bin will not penalize each other. Associations in the first (shortest) distance bin will never be altered by this process. The process moves in order of increasing distance bins, such that association probabilities are down-weighted by more proximal association probabilities that have been down-weighted already. Although this process reduces the association probability for longer associations to a CRE with high-probability shorter associations, it still allows for multiple DEGs to be assigned to a given CRE. Overall, DegCre is capable of associating multiple CREs to a given single DEG, as well as multiple DEGs to a given single CRE, as seen in the presented data sets (Supplemental Data 2).
DegCre calculates a type of FDR for association probabilities. As a null hypothesis, abin, we consider the true DEG association probability of a given distance bin without regard to the ordering of association CRE P-values (Fig. 1D). If all associations in the bin had the same CRE P-value, their association probabilities would be abin. As described above, the process of calculating ai,j involves considering the distance bin subset Ai,j and calculating EDEG, the expected number of true DEGs. This process can be modeled as a set of Bernoulli trials in which the number of trials is the size of Ai,j, or |Ai,j|; the number of successes is EDEG; and the probability of success is abin. The FDR of the association in this case is the probability that a given association probability exceeds the value derived its association distance alone, and is given by
The choice of the DEG significance α is important as it determines, for all bins, both the raw association probability araw,i,j, and the corrected association probability acorr,ij. Accordingly, DegCre includes a function that optimizes across a range of test α values by maximizing the average expected precision of DegCre associations above random chance (details in package documentation). In the tested data sets, the optimization algorithm generates a curve with an inflection point representing at least a local optimum (Supplemental Fig. 21).
Data processing and visualizations
We downloaded the presented data sets from public repositories. We generated RNA-seq data used for DegCre inputs for the Hiatt et al. experiments (details following). All accession numbers are provided in Supplemental Data 1. For the ChIP-seq and ATAC-seq data from Reed et al., Savic et al., Hiatt et al., and Sanchez-Priego et al. we aligned the FASTQ files to hg38 using Bowtie 2 version 2.3.5.1 (Langmead and Salzberg 2012) and processed with SAMtools version 1.16.1 (Danecek et al. 2021) to BAM files. We obtained BAM files directly for the McDowell et al. data. We derived log fold-changes and P-values associated with GRanges from the BAM files using the R package csaw version 1.32.0 (Lun and Smyth 2016) in R version 4.2.1. For csaw analysis of TF ChIP-seq data, we used 20-bp windows and kept the top 0.5% with highest signal for differential analysis. For open chromatin assays, histone ChIP-seq, and RNA Pol2 ChIP-seq, we used 200-bp windows and kept the top 2% with highest signal. We selected these values by finding those that produced the best clustering of samples by treatment and time point within experiment sets. Within csaw, we made comparisons to the zero time or control conditions for each time point. We obtained gene count tables for all RNA-seq data. We calculated log fold-changes and P-values for each time point relative to the zero time point or control using the R package DESeq2 version 1.38.3 (Love et al. 2014). We associated these values with all TSSs for each gene using annotations from EPDNew (Dreos et al. 2015; Meylan et al. 2020), yielding GRanges. We lifted over Hi-C loop calls from the data of Reed et al. to hg38 using the R package rtracklayer version 1.58.0 (Lawrence et al. 2009). We ran DegCre v 0.99.12 on these data sets. Outputs from these runs are provided in Supplemental Data 2. The associations are filtered to an FDR of 0.01, lower than is used in many figures in this paper, to accommodate file size limits.
We obtained CRISPR experimental data and associated ABC calls from Supplemental Table 5 from Nasser et al. (2021). We lifted over these data to hg38 using rtracklayer version 1.58.0. We made all data visualizations using R version 4.2.1, in some cases using DegCre built-in functions. We made browser plots using functions that use the R package plotgardener (Kramer et al. 2022).
For the Nasser et al. data, we obtained CRISPR validation data as Supplemental Table 5 from Nasser et al. (2021). For the Gasperini et al. data, we obtained the results from the NCBI Gene Expression Omnibus (GEO; https://www.ncbi.nlm.nih.gov/geo/) under accession number GSE120861 (Supplemental Data 1). We lifted over the Gasperini et al. data to hg38 using the R package rtracklayer version 1.58.0 (Lawrence et al. 2009). We converted both data sets to GRanges and used the GenomicRanges findOverlaps command to intersect with DegCre associations. We generated PR curves and AUCs using base R commands.
RNA-seq of ZMYM3 variant cells
We edited HepG2 cells with ZMYM3 R688H or R1274W mutations generated as described previously (Hiatt et al. 2023). We isolated total RNA from these cells using a Norgen total RNA purification kit (Norgen 37500) according to the manufacturer's protocol and quantified using the Qubit RNA HS assay kit (Thermo Fisher Scientific Q32855). We used 500 ng of RNA as input for the QuantSeq 3′ mRNA-seq library prep kit FWD for Illumina and UMI second-strand synthesis module for QuantSeq FWD (Illumina, read 1) from Lexogen. We quantified libraries using the Qubit DNA HS assay kit (Thermo Fisher Scientific Q32854) and visualized with the Bioanalyzer high-sensitivity DNA analysis kit (Agilent 5067–4626) and 2100 Bioanalyzer instrument (Agilent). Sequencing was performed using Illumina NextSeq 75-bp single-end. We extracted UMIs first from the reads with UMI-tools version 1.1.4 (Smith et al. 2017). We then trimmed reads with bbduk.sh from BBMap version 39.01 and aligned to a custom GRCh38-GENCODEv43 reference genome containing the reference for the ZMYM3_FLAG integrated in HepG2 using STAR version 2.7.10b (Dobin et al. 2013) with the Lexogen recommended parameters for QuantSeq. We deduplicated BAM files by UMI and mapping coordinates using UMI-tools dedup. Subsequently, we used SAMtools version 1.17 (Danecek et al. 2021) to shuffle the BAM files and generate deduplicated FASTQ files. We mapped using Salmon version 1.10.1 (the ‐‐noLengthCorrection flag was used for QuantSeq samples) (Patro et al. 2017) to obtain transcript abundance counts. We used Tximeta version 1.10.0 (Love et al. 2020) to obtain gene-level count estimates.
Single-nucleus multiomic analysis
We made pseudobulk metacells for snRNA-seq and snATAC-seq using the clusters defined previously (Rogers et al. 2024). We evenly divided each cluster into three metacells. We summed the snRNA-seq counts across all cells in a metacell. For snATAC-seq, we adjusted barcode flags in the “CB:Z” field of the BAM files to agree with the barcodes found in the aggregated counts matrix and to prevent barcode overlap between 10x lanes. We combined BAM files across all 10x lanes and then split them into metacell BAMs using a list of barcodes for that metacell.
For gene-peak links, we filtered RNA and ATAC counts to the clusters being analyzed and then renormalized. RNA counts were log-normalized with a scale factor of 10,000. We normalized the ATAC counts with term-frequency inverse-document-frequency (TFIDF). We called links using Signac “LinkPeaks” with a P-value cutoff of one and absolute correlation cutoff of 0.05. A minimum of 10 cells containing both the gene and peak was required for the link to be included in the results.
Data access
All raw and processed sequencing data generated in this study have been submitted to the NCBI Gene Expression Omnibus (GEO; https://www.ncbi.nlm.nih.gov/geo/) under accession number GSE259222. The latest version of the DegCre package can be obtained on Bioconductor (https://www.bioconductor.org/packages/devel/bioc/html/DegCre.html). The version used in the presented analyses is available on GitHub (https://github.com/brianSroberts/DegCre/releases/tag/v0.99.12). The R source code is also included as Supplemental Code. Any issues or feature requests can be made on GitHub.
Supplementary Material
Acknowledgments
This work was generously supported by the Leo Fund. We thank the members of Myers Laboratory for useful discussions and suggestions.
Author contributions: B.S.R. conceived of the method, performed analyses, and wrote the manuscript. A.G.A. performed analyses. E.C.P. performed experiments and generated data. G.M.C. supervised and helped conceive the method. R.M.M. supervised the overall project.
Footnotes
[Supplemental material is available for this article.]
Article published online before print. Article, supplemental material, and publication date are at https://www.genome.org/cgi/doi/10.1101/gr.278598.123.
Competing interest statement
The authors declare no competing interests.
References
- Adamson B, Norman TM, Jost M, Cho MY, Nuñez JK, Chen Y, Villalta JE, Gilbert LA, Horlbeck MA, Hein MY, et al. 2016. A multiplexed single-cell CRISPR screening platform enables systematic dissection of the unfolded protein response. Cell 167: 1867–1882.e21. 10.1016/j.cell.2016.11.048 [DOI] [PMC free article] [PubMed] [Google Scholar]
- Bardy C, van den Hurk M, Eames T, Marchand C, Hernandez RV, Kellogg M, Gorris M, Galet B, Palomares V, Brown J, et al. 2015. Neuronal medium that supports basic synaptic functions and activity of human neurons in vitro. Proc Natl Acad Sci USA 112: E2725–E2734. 10.1073/pnas.1504393112 [DOI] [PMC free article] [PubMed] [Google Scholar]
- Cao Q, Anyansi C, Hu X, Xu L, Xiong L, Tang W, Mok MTS, Cheng C, Fan X, Gerstein M, et al. 2017. Reconstruction of enhancer–target networks in 935 samples of human primary cells, tissues and cell lines. Nat Genet 49: 1428–1436. 10.1038/ng.3950 [DOI] [PubMed] [Google Scholar]
- Carleton JB, Ginley-Hidinger M, Berrett KC, Layer RM, Quinlan AR, Gertz J. 2020. Regulatory sharing between estrogen receptor α bound enhancers. Nucleic Acids Res 48: 6597–6610. 10.1093/nar/gkaa454 [DOI] [PMC free article] [PubMed] [Google Scholar]
- Cholico GN, Nault R, Zacharewski TR. 2022. Genome-wide ChIPseq analysis of AhR, COUP-TF, and HNF4 enrichment in TCDD-treated mouse liver. Int J Mol Sci 23: 1558. 10.3390/ijms23031558 [DOI] [PMC free article] [PubMed] [Google Scholar]
- Danecek P, Bonfield JK, Liddle J, Marshall J, Ohan V, Pollard MO, Whitwham A, Keane T, McCarthy SA, Davies RM, et al. 2021. Twelve years of SAMtools and BCFtools. GigaScience 10: giab008. 10.1093/gigascience/giab008 [DOI] [PMC free article] [PubMed] [Google Scholar]
- Dixon JR, Selvaraj S, Yue F, Kim A, Li Y, Shen Y, Hu M, Liu JS, Ren B. 2012. Topological domains in mammalian genomes identified by analysis of chromatin interactions. Nature 485: 376–380. 10.1038/nature11082 [DOI] [PMC free article] [PubMed] [Google Scholar]
- Dobin A, Davis CA, Schlesinger F, Drenkow J, Zaleski C, Jha S, Batut P, Chaisson M, Gingeras TR. 2013. STAR: ultrafast universal RNA-seq aligner. Bioinformatics 29: 15–21. 10.1093/bioinformatics/bts635 [DOI] [PMC free article] [PubMed] [Google Scholar]
- Dreos R, Ambrosini G, Périer RC, Bucher P. 2015. The eukaryotic promoter database: expansion of EPDnew and new promoter analysis tools. Nucleic Acids Res 43: D92–D96. 10.1093/nar/gku1111 [DOI] [PMC free article] [PubMed] [Google Scholar]
- The ENCODE Project Consortium, Moore JE, Purcaro MJ, Pratt HE, Epstein CB, Shoresh N, Adrian J, Kawli T, Davis CA, Dobin A, et al. 2020. Expanded encyclopaedias of DNA elements in the human and mouse genomes. Nature 583: 699–710. 10.1038/s41586-020-2493-4 [DOI] [PMC free article] [PubMed] [Google Scholar]
- Ernst J, Kheradpour P, Mikkelsen TS, Shoresh N, Ward LD, Epstein CB, Zhang X, Wang L, Issner R, Coyne M, et al. 2011. Mapping and analysis of chromatin state dynamics in nine human cell types. Nature 473: 43–49. 10.1038/nature09906 [DOI] [PMC free article] [PubMed] [Google Scholar]
- Fang R, Preissl S, Li Y, Hou X, Lucero J, Wang X, Motamedi A, Shiau AK, Zhou X, Xie F, et al. 2021. Comprehensive analysis of single cell ATAC-seq data with SnapATAC. Nat Commun 12: 1337. 10.1038/s41467-021-21583-9 [DOI] [PMC free article] [PubMed] [Google Scholar]
- Finner H, Roters M. 2002. Multiple hypotheses testing and expected number of type I errors. Ann Stat 30: 220–238. 10.1214/aos/1015362191 [DOI] [Google Scholar]
- Fulco CP, Nasser J, Jones TR, Munson G, Bergman DT, Subramanian V, Grossman SR, Anyoha R, Doughty BR, Patwardhan TA, et al. 2019. Activity-by-contact model of enhancer-promoter regulation from thousands of CRISPR perturbations. Nat Genet 51: 1664–1669. 10.1038/s41588-019-0538-0 [DOI] [PMC free article] [PubMed] [Google Scholar]
- Gasperini M, Hill AJ, McFaline-Figueroa JL, Martin B, Kim S, Zhang MD, Jackson D, Leith A, Schreiber J, Noble WS, et al. 2019. A genome-wide framework for mapping gene regulation via cellular genetic screens. Cell 176: 377–390.e19. 10.1016/j.cell.2018.11.029 [DOI] [PMC free article] [PubMed] [Google Scholar]
- Grosveld F, van Assendelft GB, Greaves DR, Kollias G. 1987. Position-independent, high-level expression of the human β-globin gene in transgenic mice. Cell 51: 975–985. 10.1016/0092-8674(87)90584-8 [DOI] [PubMed] [Google Scholar]
- Haberle V, Stark A. 2018. Eukaryotic core promoters and the functional basis of transcription initiation. Nat Rev Mol Cell Biol 19: 621–637. 10.1038/s41580-018-0028-8 [DOI] [PMC free article] [PubMed] [Google Scholar]
- Han L, Shen W-J, Bittner S, Kraemer FB, Azhar S. 2017. PPARs: regulators of metabolism and as therapeutic targets in cardiovascular disease. Part II: PPAR-β/δ and PPAR-γ. Future Cardiol 13: 279–296. 10.2217/fca-2017-0019 [DOI] [PMC free article] [PubMed] [Google Scholar]
- He B, Chen C, Teng L, Tan K. 2014. Global view of enhancer–promoter interactome in human cells. Proc Natl Acad Sci USA 111: E2191–E2199. 10.1073/pnas.1320308111 [DOI] [PMC free article] [PubMed] [Google Scholar]
- Hiatt SM, Trajkova S, Sebastiano MR, Partridge EC, Abidi FE, Anderson A, Ansar M, Antonarakis SE, Azadi A, Bachmann-Gagescu R, et al. 2023. Deleterious, protein-altering variants in the transcriptional coregulator ZMYM3 in 27 individuals with a neurodevelopmental delay phenotype. Am J Hum Genet 110: 215–227. 10.1016/j.ajhg.2022.12.007 [DOI] [PMC free article] [PubMed] [Google Scholar]
- Hu X, Shen B, Liao S, Ning Y, Ma L, Chen J, Lin X, Zhang D, Li Z, Zheng C, et al. 2017. Gene knockout of Zmym3 in mice arrests spermatogenesis at meiotic metaphase with defects in spindle assembly checkpoint. Cell Death Dis 8: e2910. 10.1038/cddis.2017.228 [DOI] [PMC free article] [PubMed] [Google Scholar]
- Javierre BM, Burren OS, Wilder SP, Kreuzhuber R, Hill SM, Sewitz S, Cairns J, Wingett SW, Várnai C, Thiecke MJ, et al. 2016. Lineage-specific genome architecture links enhancers and non-coding disease variants to target gene promoters. Cell 167: 1369–1384.e19. 10.1016/j.cell.2016.09.037 [DOI] [PMC free article] [PubMed] [Google Scholar]
- Juszczak GR, Stankiewicz AM. 2018. Glucocorticoids, genes and brain function. Prog Neuropsychopharmacol Biol Psychiatry 82: 136–168. 10.1016/j.pnpbp.2017.11.020 [DOI] [PubMed] [Google Scholar]
- Kamal A, Arnold C, Claringbould A, Moussa R, Servaas NH, Kholmatov M, Daga N, Nogina D, Mueller-Dott S, Reyes-Palomares A, et al. 2023. GRaNIE and GRaNPA: inference and evaluation of enhancer-mediated gene regulatory networks. Mol Syst Biol 19: e11627. 10.15252/msb.202311627 [DOI] [PMC free article] [PubMed] [Google Scholar]
- Kloetgen A, Thandapani P, Ntziachristos P, Ghebrechristos Y, Nomikou S, Lazaris C, Chen X, Hu H, Bakogianni S, Wang J, et al. 2020. Three-dimensional chromatin landscapes in T cell acute lymphoblastic leukemia. Nat Genet 52: 388–400. 10.1038/s41588-020-0602-9 [DOI] [PMC free article] [PubMed] [Google Scholar]
- Kramer NE, Davis ES, Wenger CD, Deoudes EM, Parker SM, Love MI, Phanstiel DH. 2022. Plotgardener: cultivating precise multi-panel figures in R. Bioinformatics 38: 2042–2045. 10.1093/bioinformatics/btac057 [DOI] [PMC free article] [PubMed] [Google Scholar]
- Langmead B, Salzberg SL. 2012. Fast gapped-read alignment with Bowtie 2. Nat Methods 9: 357–359. 10.1038/nmeth.1923 [DOI] [PMC free article] [PubMed] [Google Scholar]
- Lawrence M, Gentleman R, Carey V. 2009. rtracklayer: an R package for interfacing with genome browsers. Bioinformatics 25: 1841–1842. 10.1093/bioinformatics/btp328 [DOI] [PMC free article] [PubMed] [Google Scholar]
- Lawrence M, Huber W, Pagès H, Aboyoun P, Carlson M, Gentleman R, Morgan MT, Carey VJ. 2013. Software for computing and annotating genomic ranges. PLoS Comput Biol 9: e1003118. 10.1371/journal.pcbi.1003118 [DOI] [PMC free article] [PubMed] [Google Scholar]
- Li W, Wong WH, Jiang R. 2019. DeepTACT: predicting 3D chromatin contacts via bootstrapping deep learning. Nucleic Acids Res 47: e60. 10.1093/nar/gkz167 [DOI] [PMC free article] [PubMed] [Google Scholar]
- Lieberman-Aiden E, van Berkum NL, Williams L, Imakaev M, Ragoczy T, Telling A, Amit I, Lajoie BR, Sabo PJ, Dorschner MO, et al. 2009. Comprehensive mapping of long-range interactions reveals folding principles of the human genome. Science 326: 289–293. 10.1126/science.1181369 [DOI] [PMC free article] [PubMed] [Google Scholar]
- Love MI, Huber W, Anders S. 2014. Moderated estimation of fold change and dispersion for RNA-seq data with DESeq2. Genome Biol 15: 550. 10.1186/s13059-014-0550-8 [DOI] [PMC free article] [PubMed] [Google Scholar]
- Love MI, Soneson C, Hickey PF, Johnson LK, Pierce NT, Shepherd L, Morgan M, Patro R. 2020. Tximeta: reference sequence checksums for provenance identification in RNA-seq. PLoS Comput Biol 16: e1007664. 10.1371/journal.pcbi.1007664 [DOI] [PMC free article] [PubMed] [Google Scholar]
- Lun ATL, Smyth GK. 2016. csaw: a Bioconductor package for differential binding analysis of ChIP-seq data using sliding windows. Nucleic Acids Res 44: e45. 10.1093/nar/gkv1191 [DOI] [PMC free article] [PubMed] [Google Scholar]
- McDaniel JM, Varley KE, Gertz J, Savic DS, Roberts BS, Bailey SK, Shevde LA, Ramaker RC, Lasseigne BN, Kirby MK, et al. 2016. Genomic regulation of invasion by STAT3 in triple negative breast cancer. Oncotarget 8: 8226–8238. 10.18632/oncotarget.14153 [DOI] [PMC free article] [PubMed] [Google Scholar]
- McDowell IC, Barrera A, D'Ippolito AM, Vockley CM, Hong LK, Leichter SM, Bartelt LC, Majoros WH, Song L, Safi A, et al. 2018. Glucocorticoid receptor recruits to enhancers and drives activation by motif-directed binding. Genome Res 28: 1272–1284. 10.1101/gr.233346.117 [DOI] [PMC free article] [PubMed] [Google Scholar]
- Meng G, Xu H, Lu D, Li S, Zhao Z, Li H, Zhang W. 2023. Three-dimensional chromatin architecture datasets for aging and Alzheimer's disease. Sci Data 10: 51. 10.1038/s41597-023-01948-z [DOI] [PMC free article] [PubMed] [Google Scholar]
- Meylan P, Dreos R, Ambrosini G, Groux R, Bucher P. 2020. EPD in 2020: enhanced data visualization and extension to ncRNA promoters. Nucleic Acids Res 48(D1): D65–D69. 10.1093/nar/gkz1014 [DOI] [PMC free article] [PubMed] [Google Scholar]
- Musunuru K, Strong A, Frank-Kamenetsky M, Lee NE, Ahfeldt T, Sachs KV, Li X, Li H, Kuperwasser N, Ruda VM, et al. 2010. From noncoding variant to phenotype via SORT1 at the 1p13 cholesterol locus. Nature 466: 714–719. 10.1038/nature09266 [DOI] [PMC free article] [PubMed] [Google Scholar]
- Myers RM, Tilly K, Maniatis T. 1986. Fine structure genetic analysis of a β-globin promoter. Science 232: 613–618. 10.1126/science.3457470 [DOI] [PubMed] [Google Scholar]
- Nasser J, Bergman DT, Fulco CP, Guckelberger P, Doughty BR, Patwardhan TA, Jones TR, Nguyen TH, Ulirsch JC, Lekschas F, et al. 2021. Genome-wide enhancer maps link risk variants to disease genes. Nature 593: 238–243. 10.1038/s41586-021-03446-x [DOI] [PMC free article] [PubMed] [Google Scholar]
- Nuñez JK, Chen J, Pommier GC, Cogan JZ, Replogle JM, Adriaens C, Ramadoss GN, Shi Q, Hung KL, Samelson AJ, et al. 2021. Genome-wide programmable transcriptional memory by CRISPR-based epigenome editing. Cell 184: 2503–2519.e17. 10.1016/j.cell.2021.03.025 [DOI] [PMC free article] [PubMed] [Google Scholar]
- Patro R, Duggal G, Love MI, Irizarry RA, Kingsford C. 2017. Salmon provides fast and bias-aware quantification of transcript expression. Nat Methods 14: 417–419. 10.1038/nmeth.4197 [DOI] [PMC free article] [PubMed] [Google Scholar]
- Rao SSP, Huntley MH, Durand NC, Stamenova EK, Bochkov ID, Robinson JT, Sanborn AL, Machol I, Omer AD, Lander ES, et al. 2014. A 3D map of the human genome at kilobase resolution reveals principles of chromatin looping. Cell 159: 1665–1680. 10.1016/j.cell.2014.11.021 [DOI] [PMC free article] [PubMed] [Google Scholar]
- R Core Team. 2022. R: a language and environment for statistical computing. R Foundation for Statistical Computing, Vienna. https://www.R-project.org/. [Google Scholar]
- Reed KSM, Davis ES, Bond ML, Cabrera A, Thulson E, Quiroga IY, Cassel S, Woolery KT, Hilton I, Won H, et al. 2022. Temporal analysis suggests a reciprocal relationship between 3D chromatin structure and transcription. Cell Rep 41: 111567. 10.1016/j.celrep.2022.111567 [DOI] [PMC free article] [PubMed] [Google Scholar]
- Rogers BB, Anderson AG, Lauzon SN, Davis MN, Hauser RM, Roberts SC, Rodriguez-Nunez I, Trausch-Lowther K, Barinaga EA, Hall PI, et al. 2024. Neuronal MAPT expression is mediated by long-range interactions with cis-regulatory elements. Am J Hum Genet 111: 259–279. 10.1016/j.ajhg.2023.12.015 [DOI] [PMC free article] [PubMed] [Google Scholar]
- Rowley MJ, Poulet A, Nichols MH, Bixler BJ, Sanborn AL, Brouhard EA, Hermetz K, Linsenbaum H, Csankovszki G, Aiden EL, et al. 2020. Analysis of Hi-C data using SIP effectively identifies loops in organisms from C. elegans to mammals. Genome Res 30: 447–458. 10.1101/gr.257832.119 [DOI] [PMC free article] [PubMed] [Google Scholar]
- Sanchez-Priego C, Hu R, Boshans LL, Lalli M, Janas JA, Williams SE, Dong Z, Yang N. 2022. Mapping cis-regulatory elements in human neurons links psychiatric disease heritability and activity-regulated transcriptional programs. Cell Rep 39: 110877. 10.1016/j.celrep.2022.110877 [DOI] [PMC free article] [PubMed] [Google Scholar]
- Savic D, Partridge EC, Newberry KM, Smith SB, Meadows SK, Roberts BS, Mackiewicz M, Mendenhall EM, Myers RM. 2015. CETCh-seq: CRISPR epitope tagging ChIP-seq of DNA-binding proteins. Genome Res 25: 1581–1589. 10.1101/gr.193540.115 [DOI] [PMC free article] [PubMed] [Google Scholar]
- Savic D, Ramaker RC, Roberts BS, Dean EC, Burwell TC, Meadows SK, Cooper SJ, Garabedian MJ, Gertz J, Myers RM. 2016. Distinct gene regulatory programs define the inhibitory effects of liver X receptors and PPARG on cancer cell proliferation. Genome Med 8: 74. 10.1186/s13073-016-0328-6 [DOI] [PMC free article] [PubMed] [Google Scholar]
- Schneider WM, Chevillotte MD, Rice CM. 2014. Interferon-stimulated genes: a complex web of host defenses. Annu Rev Immunol 32: 513–545. 10.1146/annurev-immunol-032713-120231 [DOI] [PMC free article] [PubMed] [Google Scholar]
- Schoenfelder S, Fraser P. 2019. Long-range enhancer–promoter contacts in gene expression control. Nat Rev Genet 20: 437–455. 10.1038/s41576-019-0128-0 [DOI] [PubMed] [Google Scholar]
- Sheffield NC, Thurman RE, Song L, Safi A, Stamatoyannopoulos JA, Lenhard B, Crawford GE, Furey TS. 2013. Patterns of regulatory activity across diverse human cell types predict tissue identity, transcription factor binding, and long-range interactions. Genome Res 23: 777–788. 10.1101/gr.152140.112 [DOI] [PMC free article] [PubMed] [Google Scholar]
- Smith T, Heger A, Sudbery I. 2017. UMI-tools: modeling sequencing errors in unique molecular identifiers to improve quantification accuracy. Genome Res 27: 491–499. 10.1101/gr.209601.116 [DOI] [PMC free article] [PubMed] [Google Scholar]
- Song M, Yang X, Ren X, Maliskova L, Li B, Jones IR, Wang C, Jacob F, Wu K, Traglia M, et al. 2019. Mapping cis-regulatory chromatin contacts in neural cells links neuropsychiatric disorder risk variants to target genes. Nat Genet 51: 1252–1262. 10.1038/s41588-019-0472-1 [DOI] [PMC free article] [PubMed] [Google Scholar]
- Stuart T, Srivastava A, Madad S, Lareau CA, Satija R. 2021. Single-cell chromatin state analysis with Signac. Nat Methods 18: 1333–1341. 10.1038/s41592-021-01282-5 [DOI] [PMC free article] [PubMed] [Google Scholar]
- Thormann V, Rothkegel MC, Schöpflin R, Glaser LV, Djuric P, Li N, Chung H-R, Schwahn K, Vingron M, Meijsing SH. 2018. Genomic dissection of enhancers uncovers principles of combinatorial regulation and cell type-specific wiring of enhancer–promoter contacts. Nucleic Acids Res 46: 2868–2882. 10.1093/nar/gky051 [DOI] [PMC free article] [PubMed] [Google Scholar]
- Ulirsch JC, Nandakumar SK, Wang L, Giani FC, Zhang X, Rogov P, Melnikov A, McDonel P, Do R, Mikkelsen TS, et al. 2016. Systematic functional dissection of common genetic variation affecting red blood cell traits. Cell 165: 1530–1545. 10.1016/j.cell.2016.04.048 [DOI] [PMC free article] [PubMed] [Google Scholar]
- van Arensbergen J, Pagie L, FitzPatrick VD, de Haas M, Baltissen MP, Comoglio F, van der Weide RH, Teunissen H, Võsa U, Franke L, et al. 2019. High-throughput identification of human SNPs affecting regulatory element activity. Nat Genet 51: 1160–1169. 10.1038/s41588-019-0455-2 [DOI] [PMC free article] [PubMed] [Google Scholar]
- Vettorazzi S, Nalbantoglu D, Gebhardt JCM, Tuckermann J. 2022. A guide to changing paradigms of glucocorticoid receptor function—a model system for genome regulation and physiology. FEBS J 289: 5718–5743. 10.1111/febs.16100 [DOI] [PubMed] [Google Scholar]
- Visel A, Blow MJ, Li Z, Zhang T, Akiyama JA, Holt A, Plajzer-Frick I, Shoukry M, Wright C, Chen F, et al. 2009. ChIP-seq accurately predicts tissue-specific activity of enhancers. Nature 457: 854–858. 10.1038/nature07730 [DOI] [PMC free article] [PubMed] [Google Scholar]
- Wang S, Chen XA, Hu J, Jiang J, Li Y, Chan-Salis KY, Gu Y, Chen G, Thomas C, Pugh BF, et al. 2015. ATF4 gene network mediates cellular response to the anticancer PAD inhibitor YW3-56 in triple-negative breast cancer cells. Mol Cancer Ther 14: 877–888. 10.1158/1535-7163.MCT-14-1093-T [DOI] [PMC free article] [PubMed] [Google Scholar]
- Xu J, Song F, Lyu H, Kobayashi M, Zhang B, Zhao Z, Hou Y, Wang X, Luan Y, Jia B, et al. 2022. Subtype-specific 3D genome alteration in acute myeloid leukemia. Nature 611: 387–398. 10.1038/s41586-022-05365-x [DOI] [PMC free article] [PubMed] [Google Scholar]
- You K, Wang L, Chou C-H, Liu K, Nakata T, Jaiswal A, Yao J, Lefkovith A, Omar A, Perrigoue JG, et al. 2021. QRICH1 dictates the outcome of ER stress through transcriptional control of proteostasis. Science 371: eabb6896. 10.1126/science.abb6896 [DOI] [PMC free article] [PubMed] [Google Scholar]
Associated Data
This section collects any data citations, data availability statements, or supplementary materials included in this article.