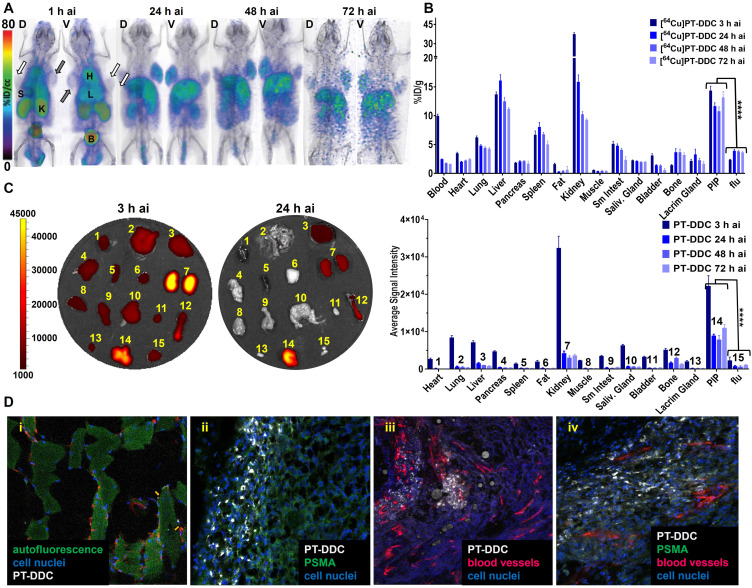
Figure 3.
Biodistribution. (A) Representative decay-corrected PET/CT volume-rendered images of mice bearing PSMA+ PC3 PIP (grey arrows) and PSMA− PC3 flu (white arrows) tumors injected with of 22.2 MBq (600 µCi) of [64Cu]PT-DDC (n=3, ai - after injection, D - dorsal, V–ventral); (B) Biodistribution of [64Cu]PT-DDC in the same PC model (n=5, mice were injected with 60 µCi, **** P<0.001); (C) Representative optical images of tissues dissected from mice bearing PSMA+ PC3 PIP and PSMA− PC3 flu tumors injected with 5 mg/kg (~100 ug) of PT-DDC and its semi-quantitative biodistribution (n=3, numbers above bars reflect numbered tissues); (D) Distribution of PT-DDC in PSMA+ PC3 PIP tumors at microscopic level (i) peritumoral fat: white - PT-DDC, green - tissue autofluorescence, red - anti-CD31-PE(R), blue - hoechst33432 (3 h ai, scale: 320.09 µm x 320.09 µm), (ii) tumor edge: white - PT-DDC, green - anti-PSMA-FITC, blue - hoechst33432 (scale: 320.09 µm x 320.09 µm), (iii) tumor parenchyma: white - PT-DDC, red - anti-CD31-PE(R), blue - hoechst33432 (scale: 1280.35 µm x 1280.35 µm), (iv) tumor parenchyma showing PT-DDC deposition associated with vasculature: white - PT-DDC, green - anti-PSMA-FITC, red - anti-CD31-PE(R), blue - hoechst33432.

