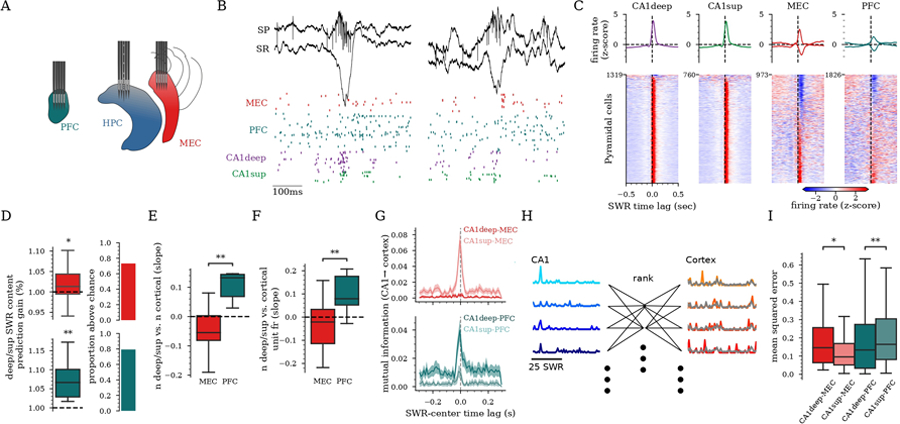
Figure 4: CA1deep and CA1sup preferentially coordinate with different downstream cortical areas during SWR.

A) Recording schematic of three silicon probes implanted in PFC, dorsal CA1, and MEC of a rat. B) Example unit responses (bottom, each row is one neuron, color-coded by brain region) to SWR (top) in each region. C) Peri-SWR firing rate responses for all pyramidal cells in each region for rats with multi-region implants (n=14 rats, Table S1). Average responses (±95% CI) (top) (positive and negative responses separated for cortex) and individual units (below). D) Left: Prediction gain of the ratio of (CA1deep/CA1sup) for cells active in SWRs calculated from cortical responses vs. shuffle distributions (dashed line) (MEC:, PFC:, t-test). Right: Proportion of sessions with the prediction accuracy above chance. E-F) Regression slopes between SWR relative content of CA1deep vs. CA1sup cells. E) and number of cortical units that responded (, rank-sum), and F) cortical firing rate responses in SWRs (, rank-sum). G) Examples of peri-SWR mutual information between cross-region cell pairs (mean±95%CI). H) Schematic of reduced rank regression used to predict neural activity in cortex from neural activity in CA1 during SWRs. Traces on the left and right reflect cell firing during SWRs. I) Mean squared error of predictions of cortical SWR responses from CA1 activity patterns using reduced rank regression ( for CA1deep/sup versus MEC, for CA1deep/sup vs. PFC, LME). D-F,I) 44 sessions, 9 rats.
