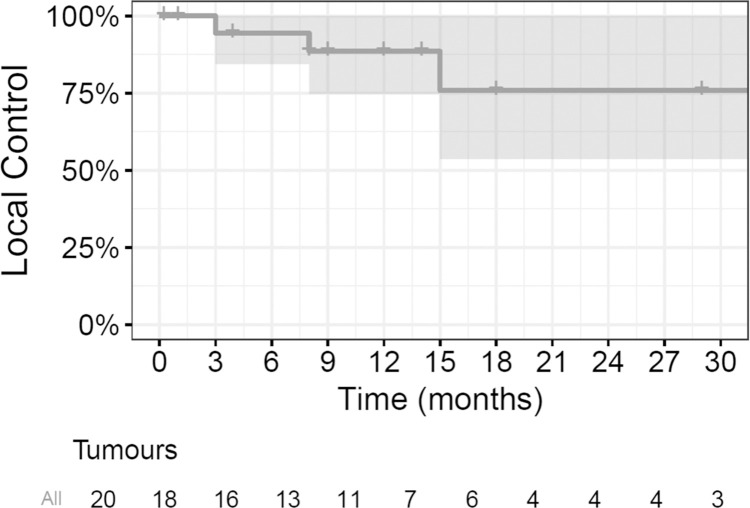
Fig 6. Kaplan–Meier curve for local control of the target tumours.
The solid line depicts the probability of local control for the 20 target tumours; the shaded area signifies the 95% confidence interval around the estimated local control probability; each step denotes an event of local failure; a short vertical line without a drop indicates the tumour was censored.

