
FIG. 3.

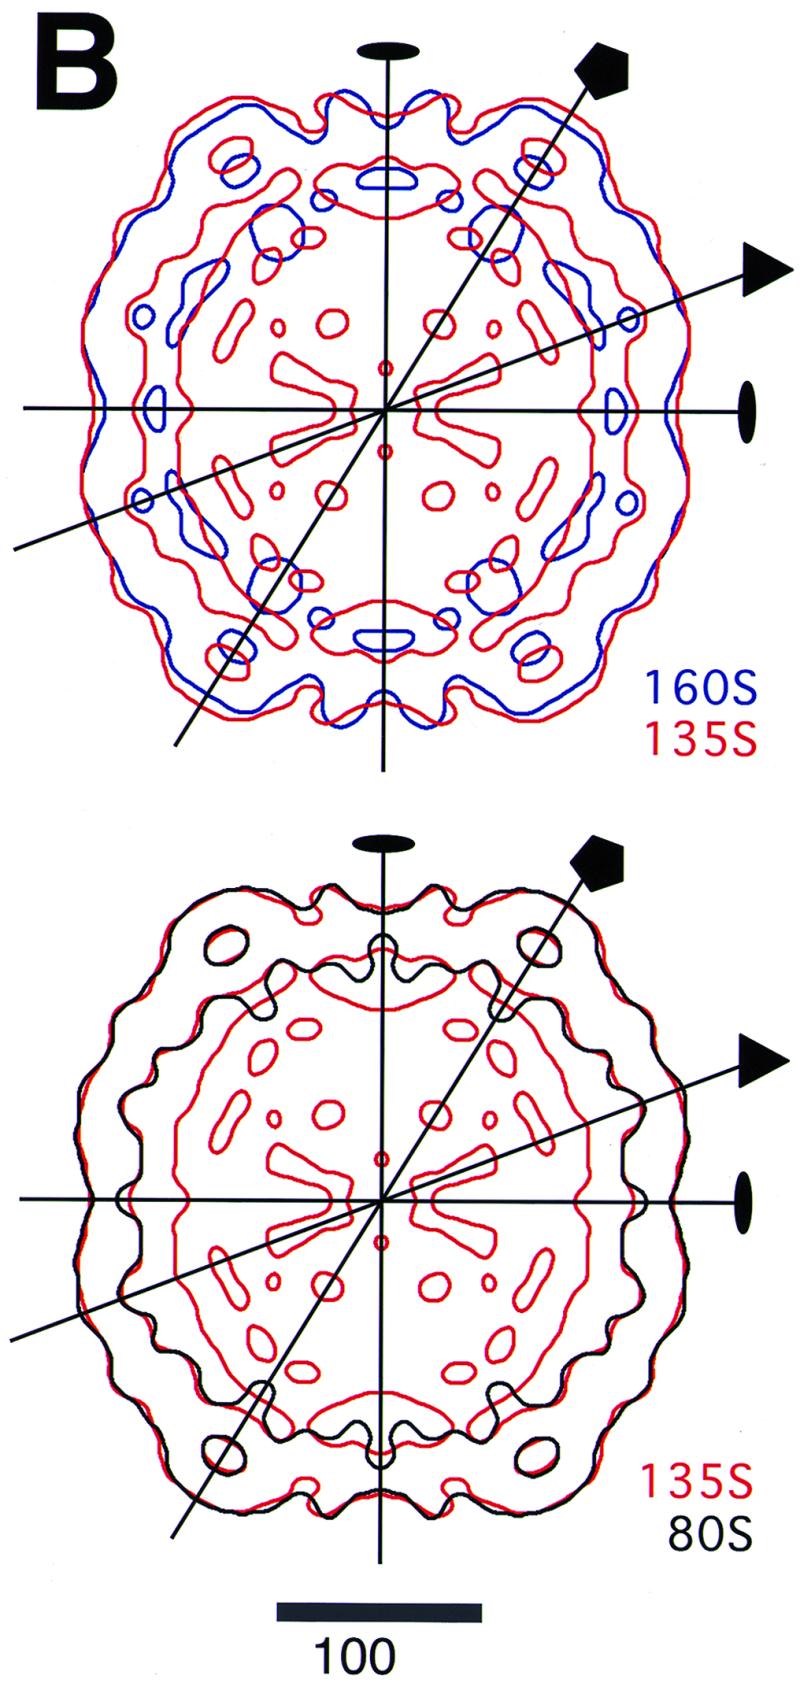
Central planar sections of the poliovirus 160S, 135S, and 80S reconstructions. Some symmetry axes are labeled. (A) Sections perpendicular to the twofold (left), fivefold (center), and threefold (right) symmetry axes. The arrows indicate the outer edge of RNA density in 160S and 135S. The arrowheads point to bubbles—regions of low density—in the middle of the capsid shell on the fivefold axes. (B) Single-level contour plots with the twofold axis normal to the page: blue, 160S; red, 135S; black, 80S. The plots are superimposed to show size relationships. The contour selected is the same level selected in Fig. 2 for the surface renderings. Bars = 100 Å.