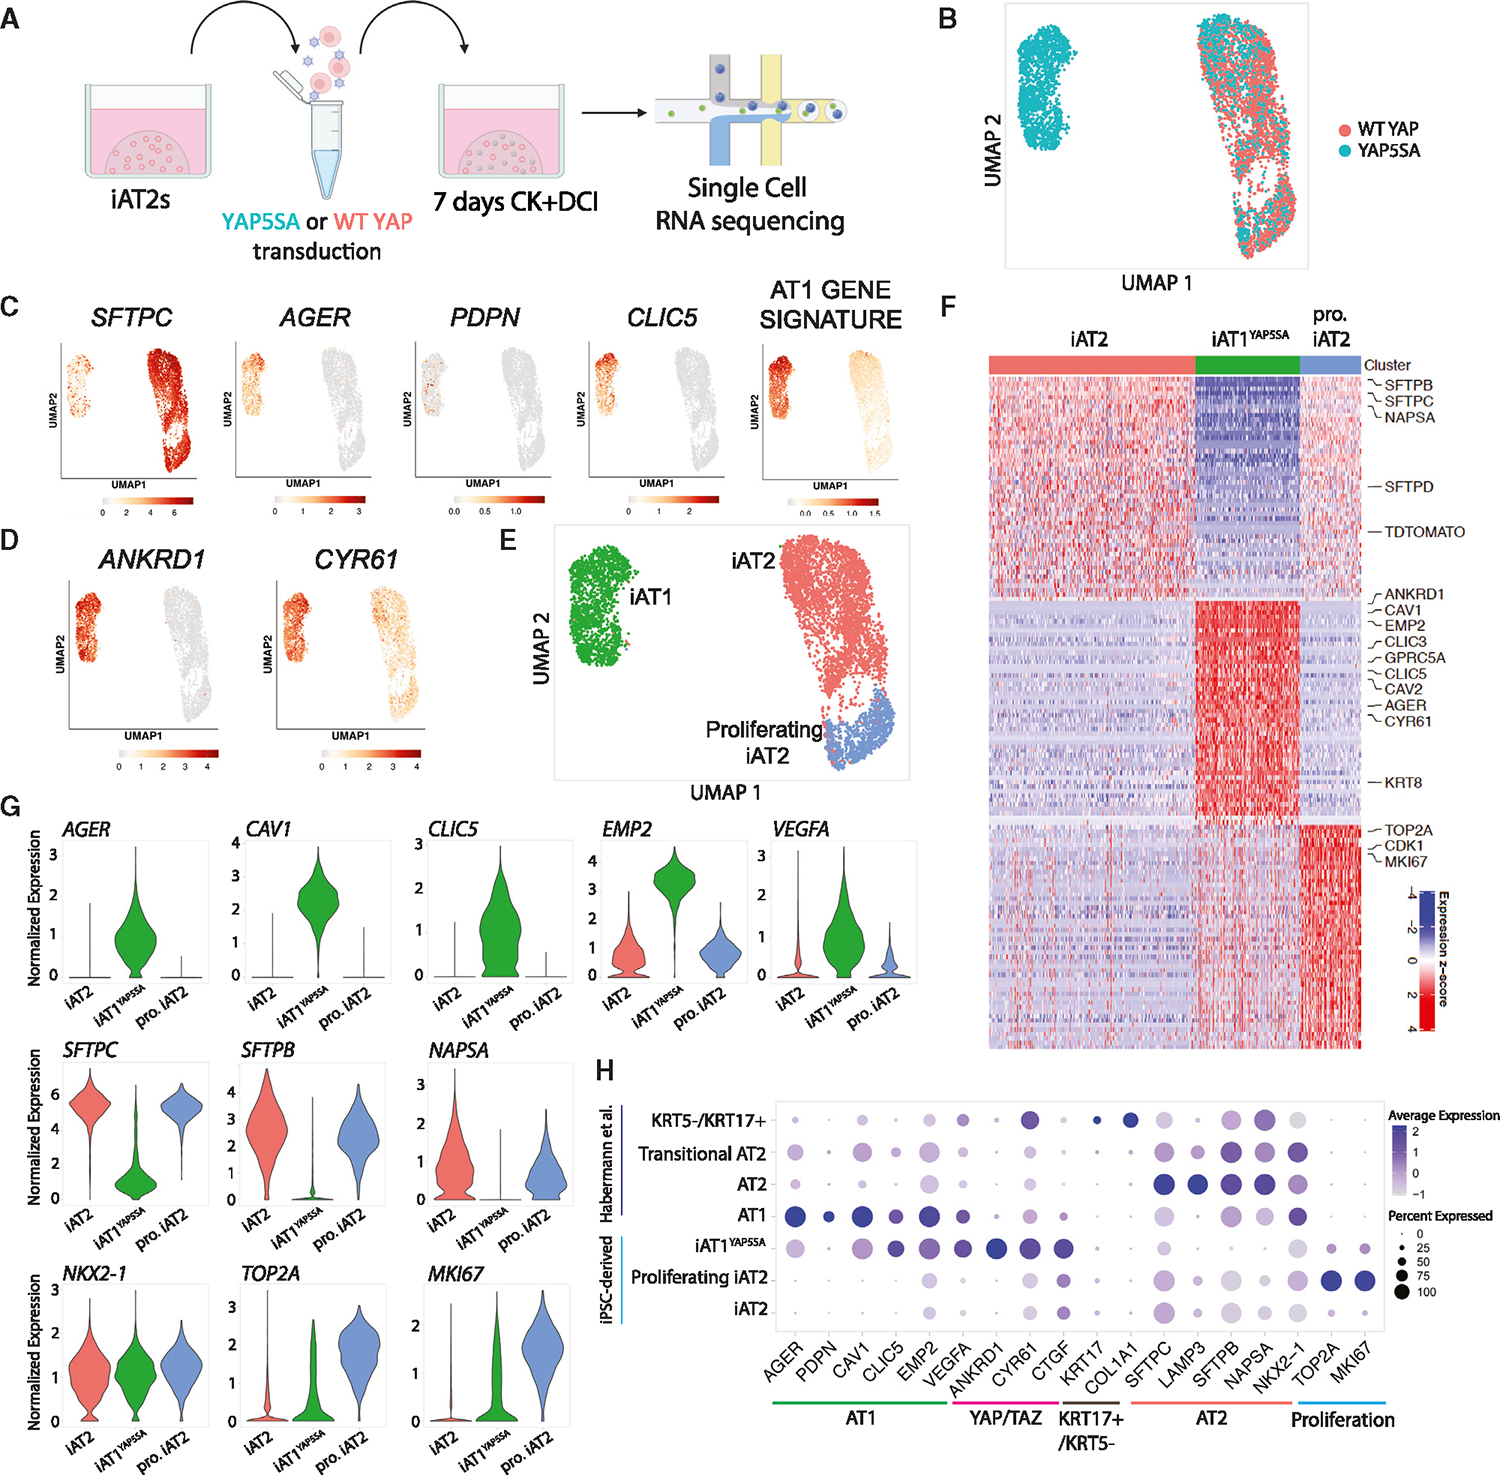
Figure 3. Nuclear YAP overexpression drives AT1 program in a cell-autonomous manner.

(A) scRNA-seq of iAT2s 7 days post WT YAP or YAP5SA lentiviral transduction (SPC2-ST-B2 clone).
(B) UMAP of WT YAP- and YAP5SA-exposed samples.
(C and D) (C) Gene expression of: select AT2 and AT1 markers and 50-gene AT1 signature (Figure 1; Table S1), and (D) select YAP downstream targets.
(E) Louvain clustering (res 0.05).
(F) Top 50 DEGs for clusters shown in (E).
(G) Gene expression of specific AT2, AT1, and proliferation markers across the clusters shown in (E) (“pro. iAT2,” proliferating iAT2s).
(H) Dot plot showing expression levels and frequencies of the indicated genes in iPSC-derived cells and scRNA-seq profiles of human adult primary populations previously published by Habermann et al.2 See also Figure S2 and Table S2.
