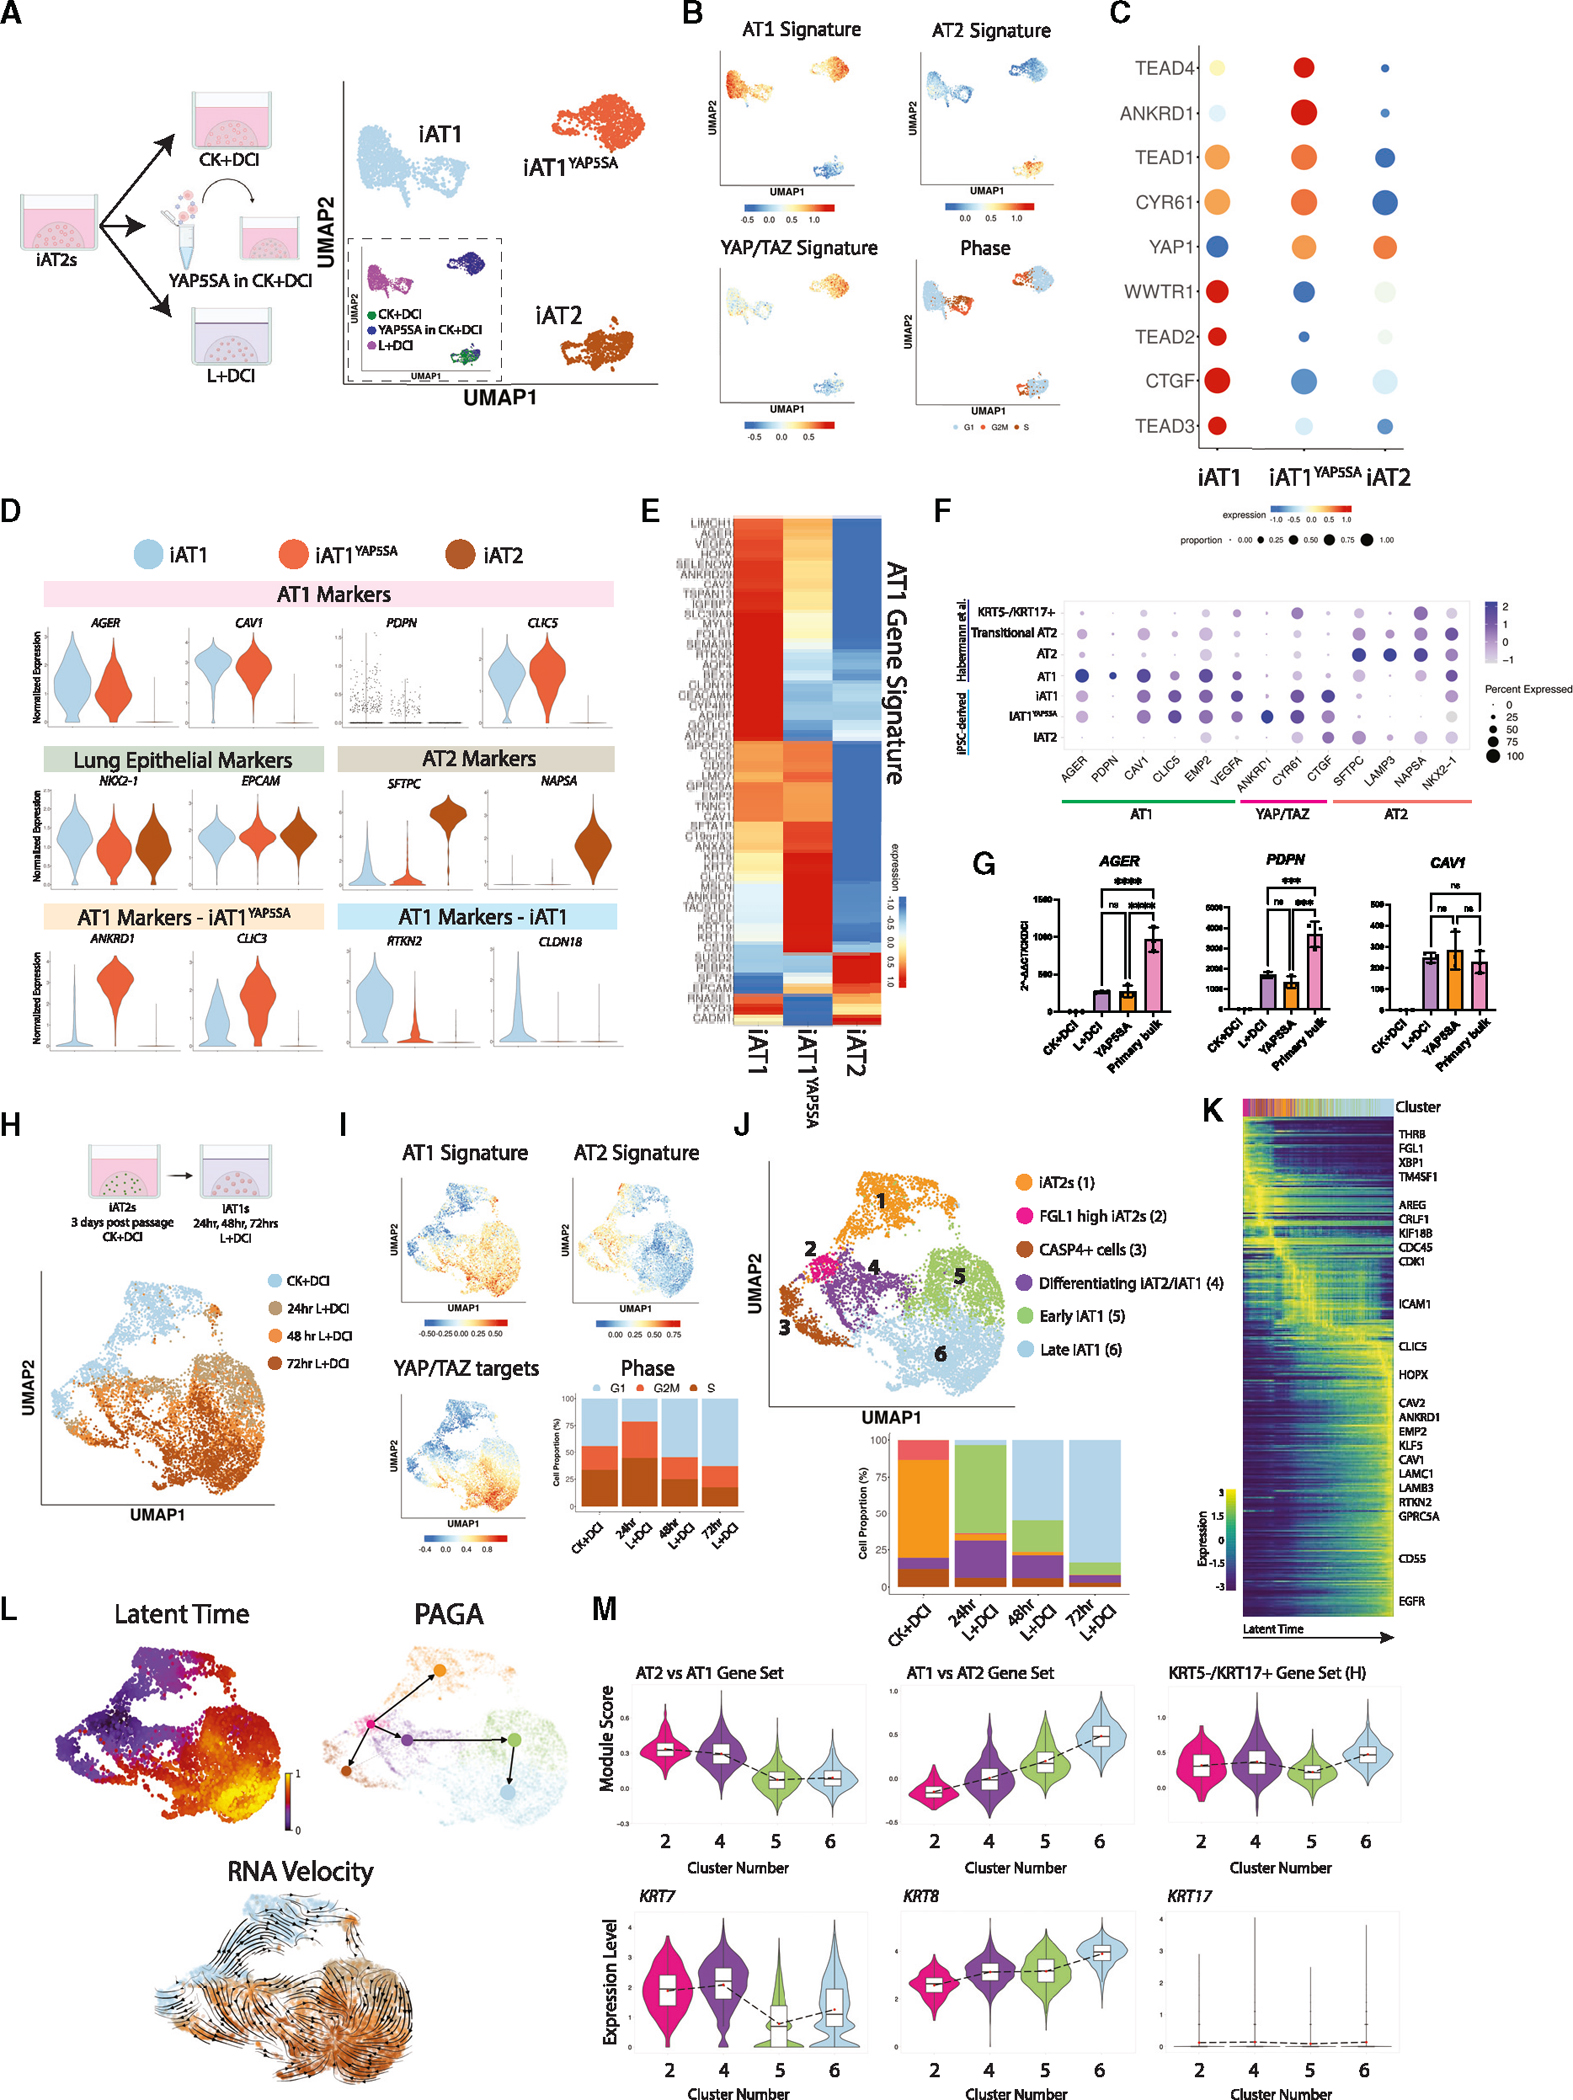
Figure 6. iAT1s generated by defined medium or lentiviral YAP5SA express a broad AT1 transcriptomic program.

(A) SPC2-ST-B2 iAT2s were grown in CK+DCI either with or without YAP5SA transduction, or grown in CK+DCI for 3 days before switching to L+DCI. 9 days post passage live cells were profiled by scRNA-seq. UMAP visualization of single-cell transcriptomes by original sample name (inset) or after Louvain clustering (res 0.05). Clusters were named iAT2, iAT1YAP5SA, and iAT1.
(B) Gene expression overlays of our AT1 50-gene signature, a 22-gene YAP/TAZ signature,58 human AT2 50-gene signature, or cell cycle phase.
(C) Dot plot of transcript expression levels/frequencies of YAP/TAZ downstream targets and TEADs.
(D) Violin plots quantifying expression of indicated markers.
(E) Heatmap showing average expression (normalized by column) of genes in the AT1 50-gene set.
(F) Dot plot showing expression levels and frequencies of AT1, AT2, and YAP/TAZ targets in this dataset compared with human adult primary populations previously published by Habermann et al.2
(G) Expression of AT1 marker genes by RT-qPCR in whole-well extracts of L+DCI-induced and YAP5SA-transduced iAT1s compared with bulk primary human distal lung tissue; fold change normalized to 18S (2^−DDCT) is calculated relative to iAT2s in CK+DCI (N = 3 wells per condition, one-way ANOVA).
(H) UMAP visualization of single-cell transcriptomes at 24 h intervals over 4 days of iAT2 (CK+DCI) to iAT1 (L+DCI) differentiation in 3D (BU3 NGAT).
(I) Gene expression overlays of human AT1 and AT2 50-gene signatures, 22-gene YAP/TAZ target signature, and cell cycle phase.
(J) UMAP visualization of Louvain clustering.
(K) Heatmap of top 300 driver genes for RNA velocity path.
(L) Pseudotime analysis visualized on UMAP (latent time, partition-based graph abstraction [PAGA], and RNA velocity).
M) Violin plots showing module scores of gene sets or expression of individual genes (H = gene set from Habermann et al.)2 *p < 0.05, **p < 0.01, ***p < 0.001, and ****p < 0.001, bars represent mean ± SD for all panels. See also Figure S6.
