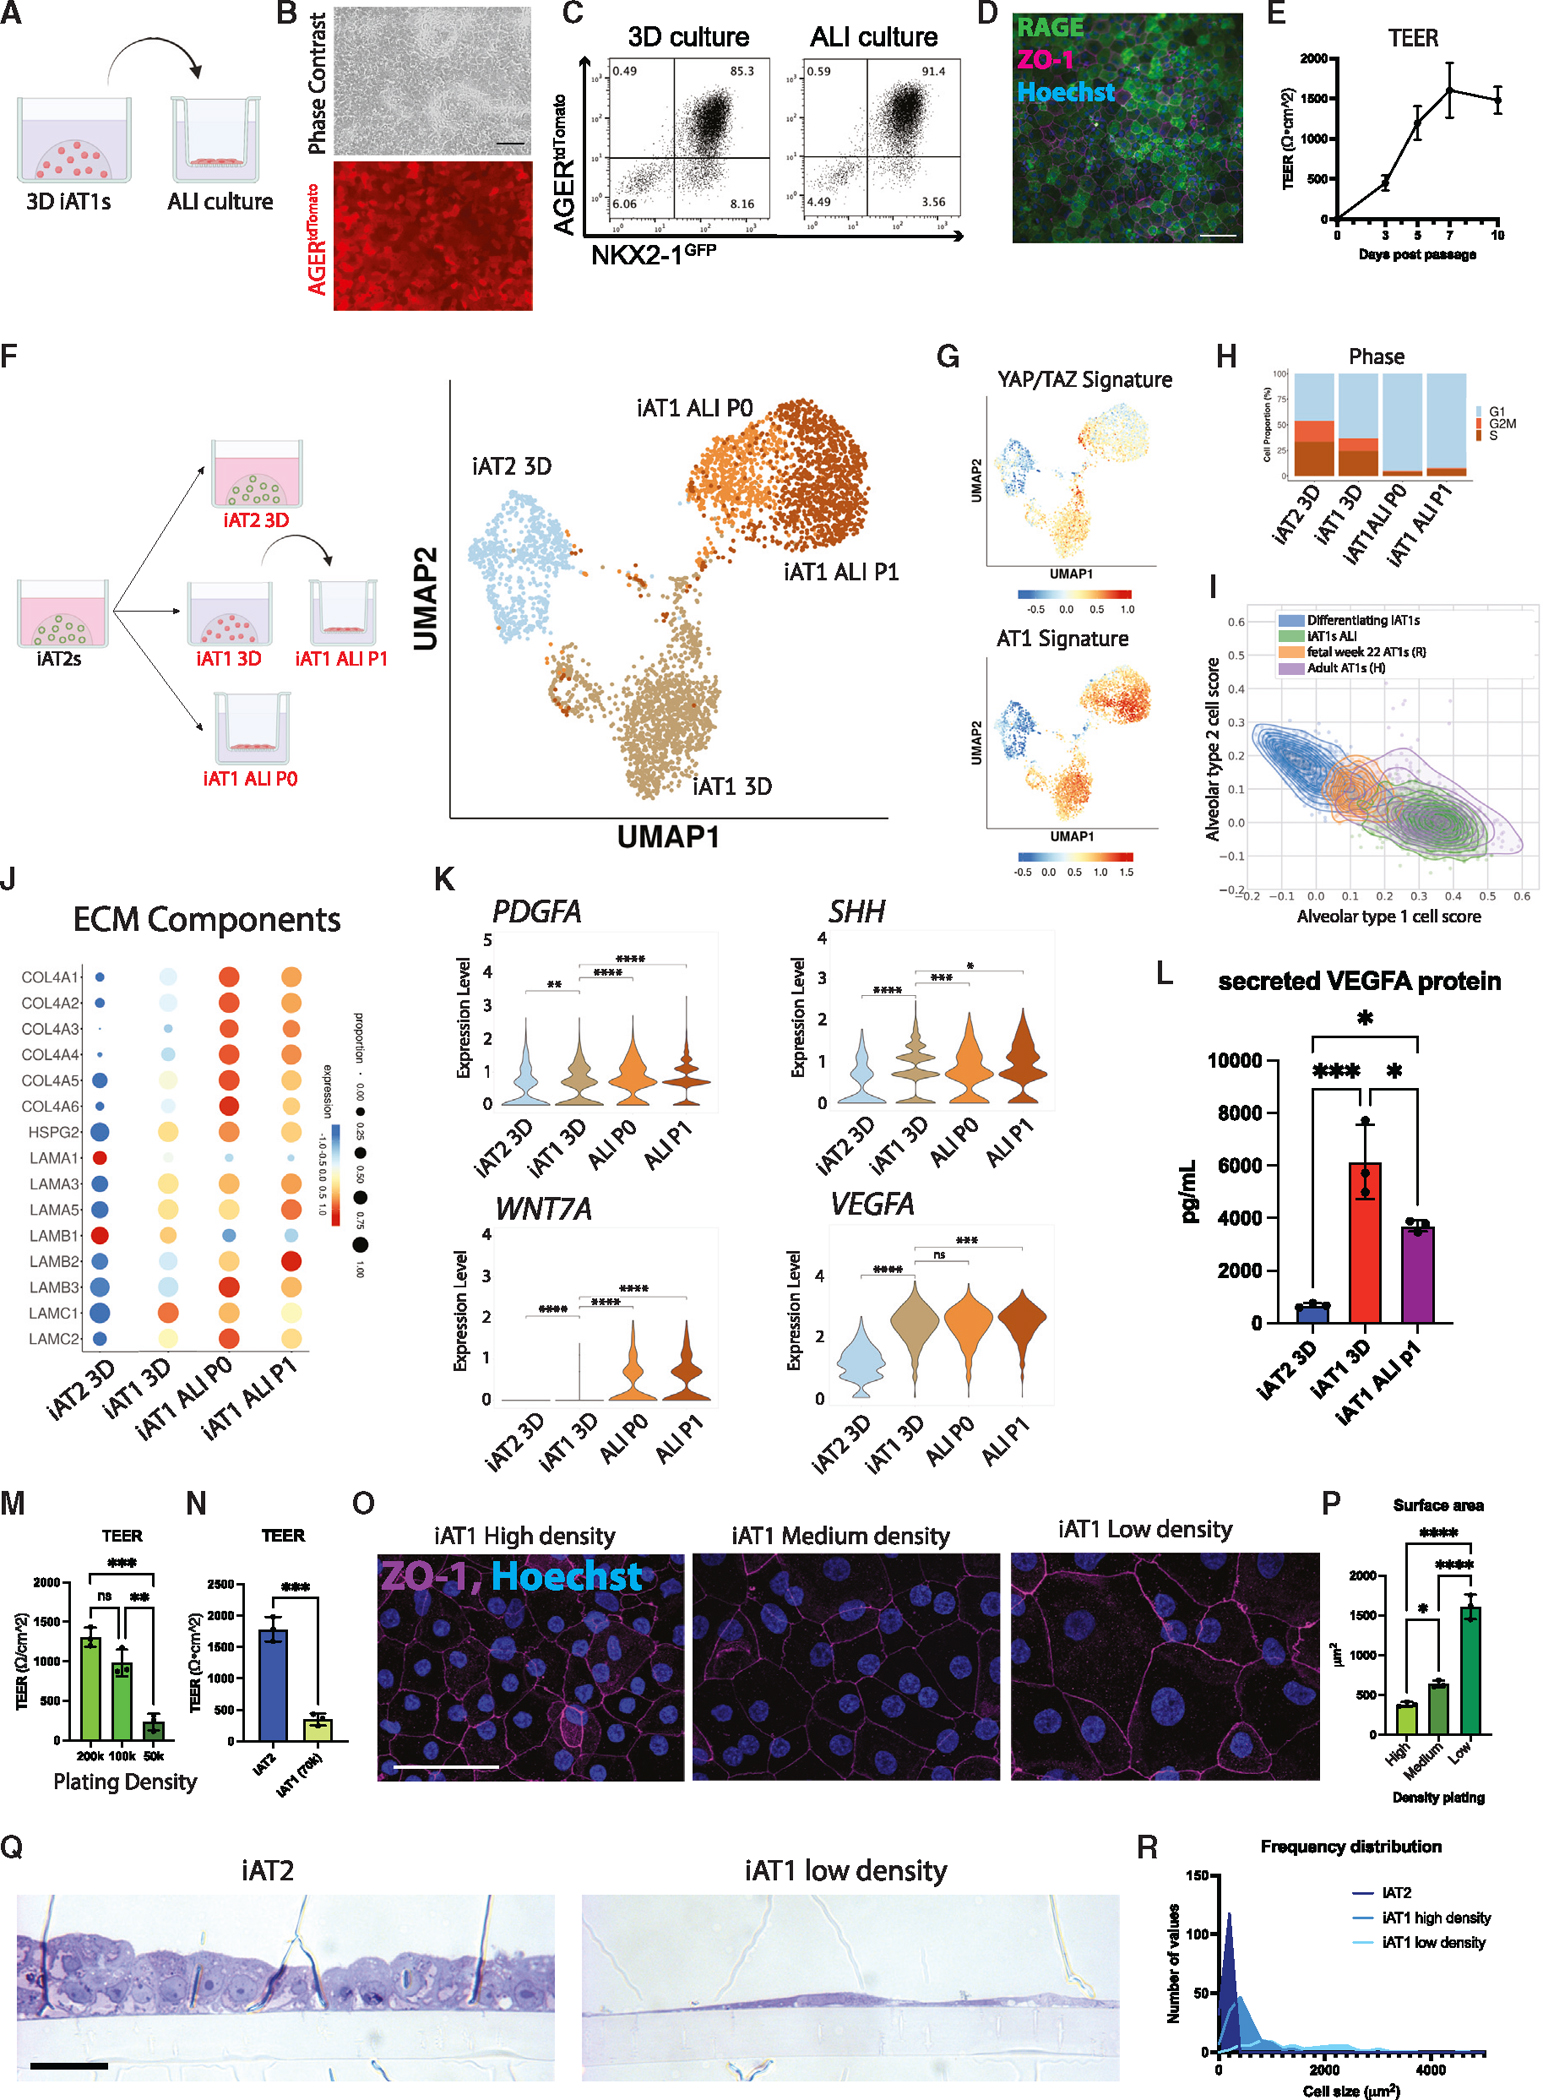
Figure 7. iAT1s cultured at air-liquid interface (ALI) express AT1-like molecular and functional phenotypes.

(A) Experimental schematic: iAT1s were cultured in 3D in L+DCI for 8–11 days before passaging and replating onto transwell inserts in L+DCI. Upper chamber media was aspirated after 3 days (airlift) to form ALI.
(B) Live cell imaging showing retention of AGERtdTomato after ALI culture (scale bar, 100 μm).
(C) Representative flow cytometry of NKX2–1GFP and AGERtdTomato expression in 3D or ALI cultures (6 days).
(D) Immunofluorescence microscopy of RAGE and ZO-1 in iAT1s at ALI (scale bar, 100 μM).
(E) Transepithelial electrical resistance (TEER) measurements of BU3 NGAT iAT1s over 10 days of ALI cultures (air lifted at day 3; N = 3).
(F) scRNA-seq profiling of iAT2s in 3D CK+DCI; iAT1s in 3D L+DCI; or iAT1s in ALI cultures, which were plated either from iAT2s into L+DCI (iAT1 ALI P0) or from 3DiAT1s after 9 days pre-culturing in 3D L+DCI (iAT1 ALI P1).
(G) UMAP overlays of YAP/TAZ 22-gene signature58 and primary human AT1 50-gene signature (Table S1).
(H) Cell cycle phase distribution across samples.
(I) Alignment scores to primary human AT1 and AT2s using scTOP64 analysis comparing two iAT1 populations (differentiating iAT1/iAT2—Figure 6 and iAT1s ALI—this figure) with primary human fetal lung at 22 weeks65 and adult primary human AT1s.2
(J and K) Expression of transcripts encoding (J) ECM components and (K) secreted ligands, comparing the samples from (E) (pairwise t test).
(L) Analysis of secreted VEGFA protein in conditioned media at day 10 of culture of each indicated sample (N = 3 wells per condition, one-way ANOVA).
(M) TEER of iAT1s after plating at high, medium, and low densities and outgrowth in ALI cultures in L+DCI (N = 3 wells per condition, one-way ANOVA).
(N) TEER of iAT2s compared with iAT1s plated at low density (SPC2-ST-B2) (N = 3 wells per condition, Student’s t test).
(O) Tight junction protein ZO-1 staining (magenta) at high, medium, and low plating density outgrowths at day 10 (scale bars, 50 μm).
(P) Average surface area of cells calculated using ZO-1 cell outlines at different iAT1 ALI plating densities (N = 3 per condition, averaged from ~150 cells per sample).
(Q) Cross-sectional imaging of SPC2-ST-B2 iAT2s at ALI and iAT1 P1s plated at low densities (Toluidine blue stain, scale bars, 10 μm).
(R) Frequency distribution of cell surface areas of iAT2, iAT1 high density, and iAT1 low density (N = 149, 139, and 79, respectively). *p < 0.05, **p < 0.01, ***p < 0.001, and ****p < 0.001, bars represent mean ± SD for all panels, BU3 NGAT iPSC line unless otherwise noted. See also Figure S7.
