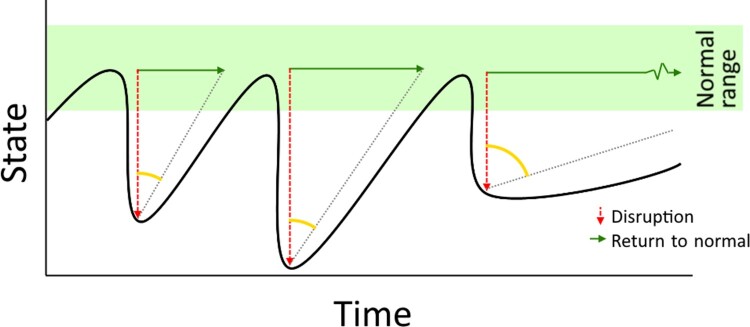
Figure 1.
Hypothetical time series of an athlete’s state which drops after a given stressor (dashed red arrow), and returns (solid green arrow) within the normal range for the individual (highlighted in green). The relation between the disruption and the return as visualized by the return angle captures how resilient the athlete is at that moment. In this hypothetical example, a resilience loss would be an abnormal angle indicating that the individual does not return quickly enough.

