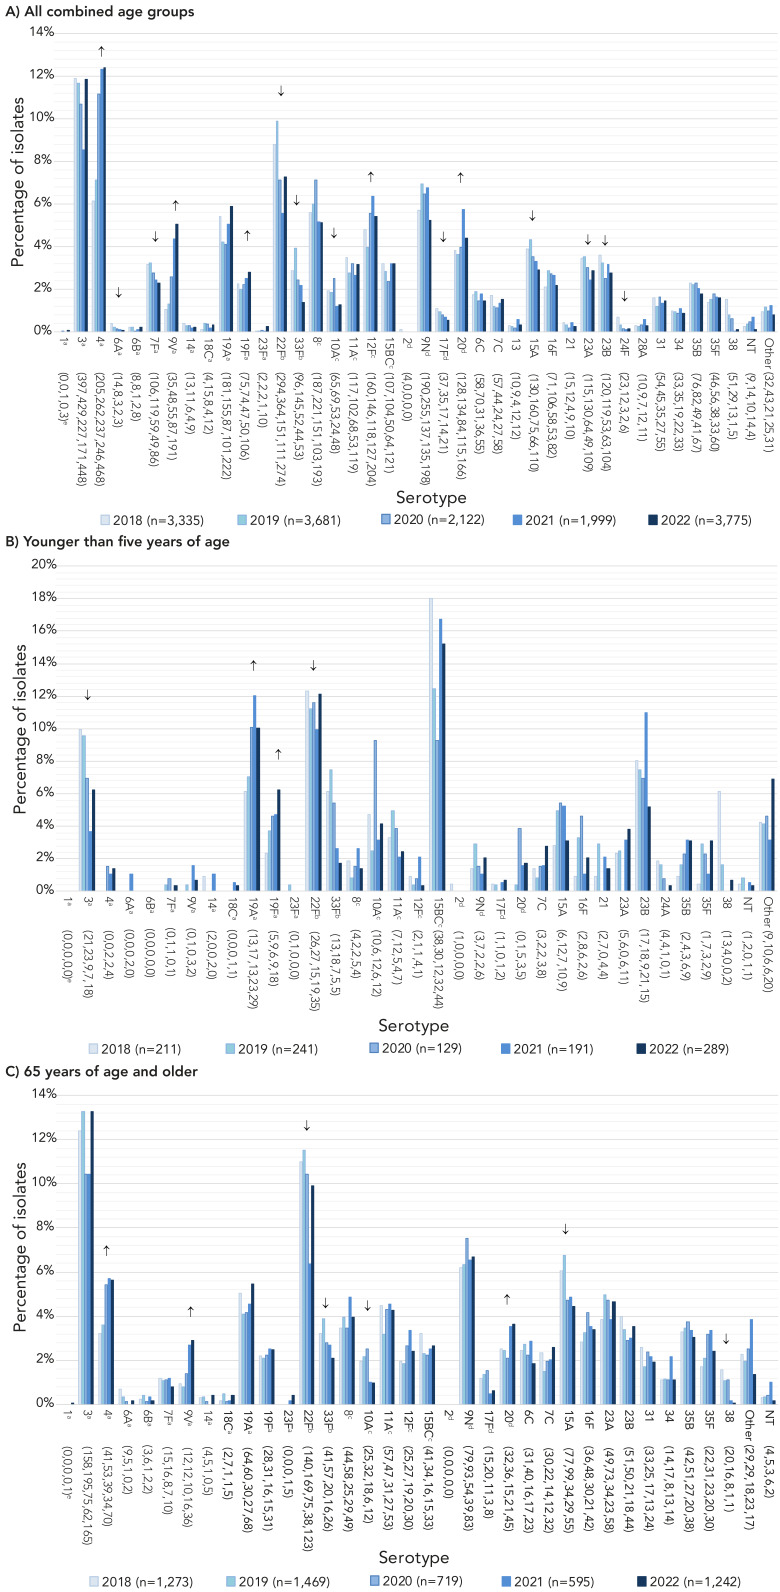
Figure 2.
Invasive Streptococcus pneumoniae serotype prevalence trends by age, 2018–2022a,b,c,d,e,f,g
a Component of PCV13
b Component of PCV15
c Component of PCV20
d Component of PPV23
e Number of isolates for 2018, 2019, 2020, 2021 and 2022, respectively
f For serotypes with an overall (2018–2022) N≥30: up or down arrows indicate statistically significant trends toward increasing or decreasing prevalence for the 2018–2022 timespan, using the chi-squared test for trend. Serotypes with no arrow either did not demonstrate a statistically significant trend, or did not have an overall N≥30
g Serotypes 15B and 15C were grouped together as 15B/C because of reported reversible switching between them in vivo during infection, making it difficult to precisely differentiate between the two types (18,19). Trends for more detailed age groups can be found in the Appendix, Figures S8 to S12

