. 2024 Jun 3;13:RP93686. doi: 10.7554/eLife.93686

Figure 5. Density associated with the K125E mutant.

(a) Superposition of density for K125E90 D6 averaged map (blue) on the density for the K125R90 D6 averaged maps (orange). The ovals show the position of TM2 from each subunit and the arrows show the direction of the difference between TM2 in the two structures. (b) As (a) but focussed on TM2 in a view approximately perpendicular to the membrane. (c) Superposition of density for WT90 connexin26 (Cx26) (PDB ID 7QEQ; pink) D6 averaged maps on the density for R125E90 (orange). (d) Density associated with one subunit of the K125E90 structure (unsharpened map). The structure has been coloured as in Figure 1c. (e) Superposition of K125E90 structure (light blue) on the structure of lauryl maltose neopentyl glycol (LMNG)-NConst (cyan) showing the similarity between the two structures.

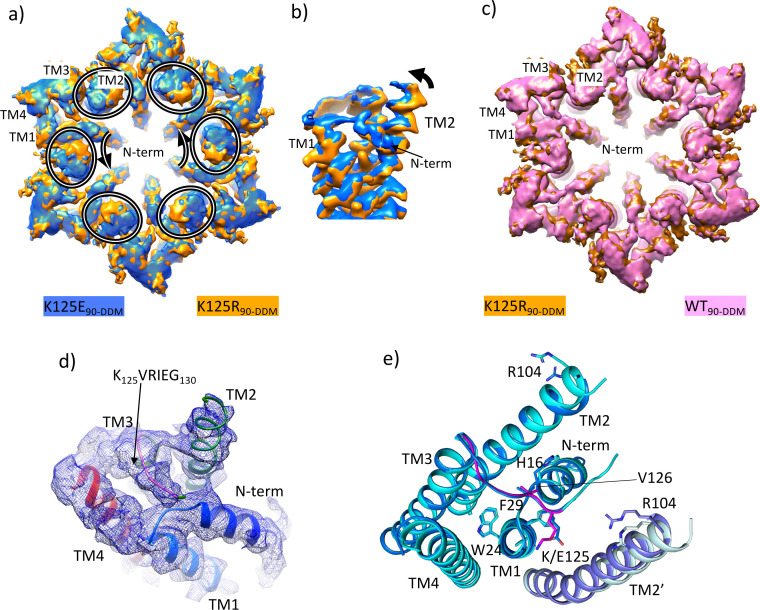
Figure 5.

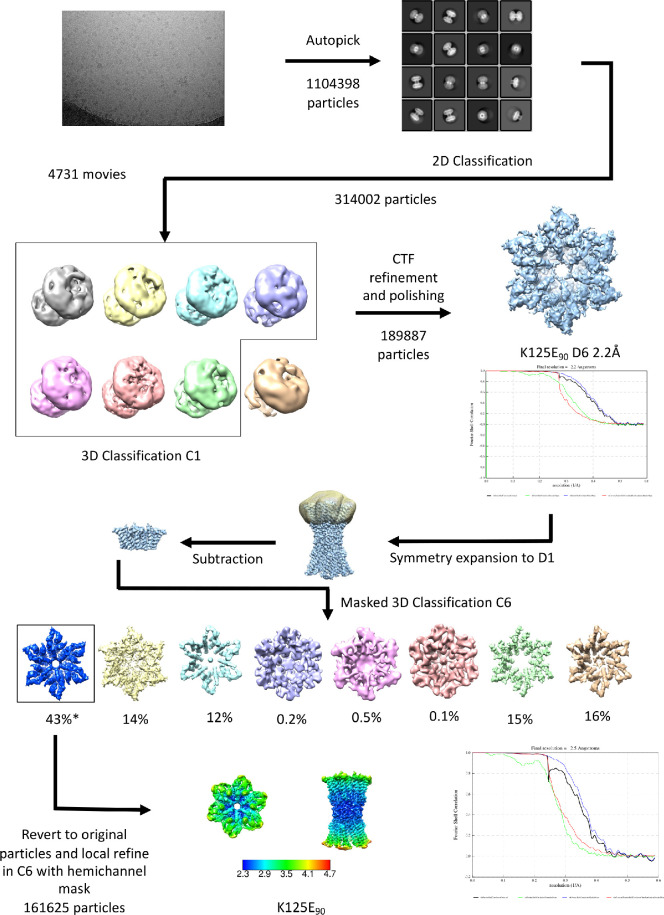
Figure 5—figure supplement 1. Workflow for processing of cryo-EM data for K125E sample in CO2/HCO3- buffer.

Figure 5—figure supplement 1.

The star denotes the classifications with the appearance of the NConst conformation that refine to a resolution greater than 4 Å. The maps in the lower panel are coloured according to resolution as estimated in Relion 4.
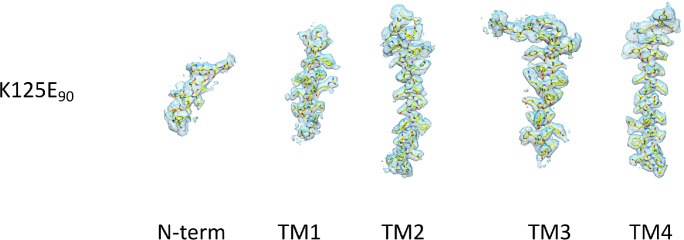
Figure 5—figure supplement 2. Density for the transmembrane and N-terminal helix associated with the K125E structure.

Figure 5—figure supplement 2.

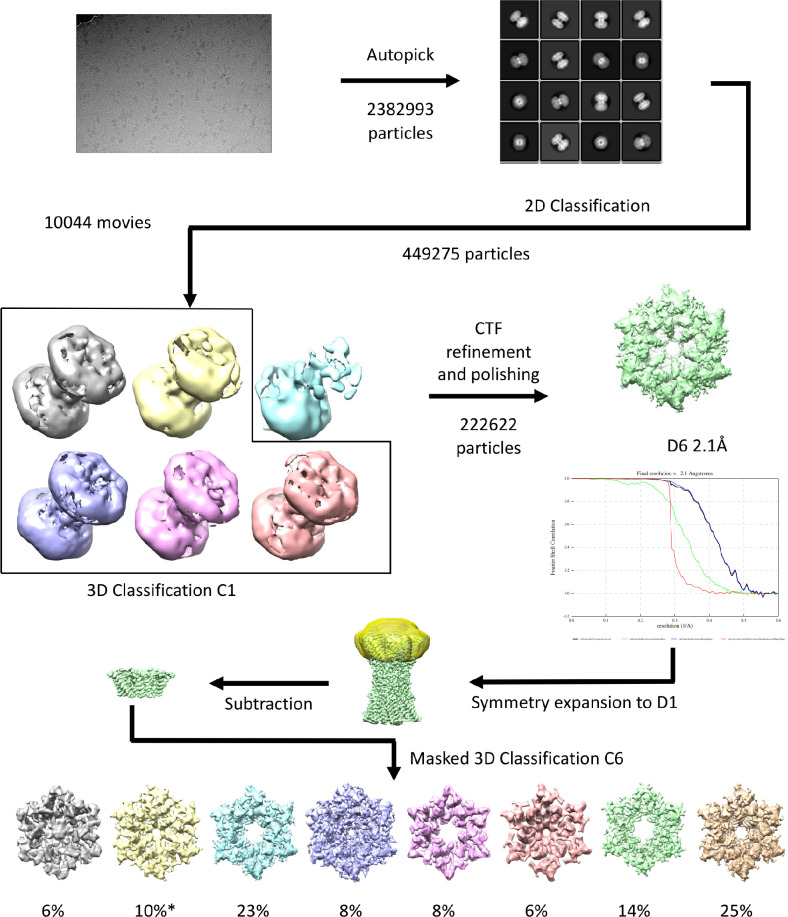
Figure 5—figure supplement 3. Workflow for processing of cryo-EM data for K125R sample in CO2/HCO3- buffer.

Figure 5—figure supplement 3.

The star denotes the classifications with the appearance of the NConst conformation that refine to a resolution greater than 4 Å.
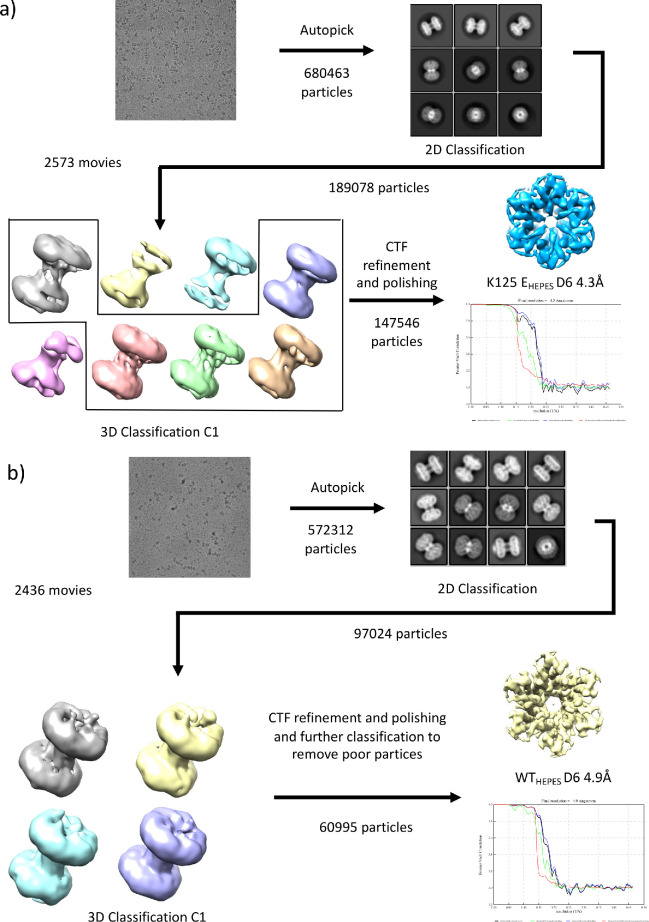
Figure 5—figure supplement 4. Workflows for processing of cryo-EM data for samples in HEPES buffer.

Figure 5—figure supplement 4.

(a) K125EHEPES (b) WTHEPES.
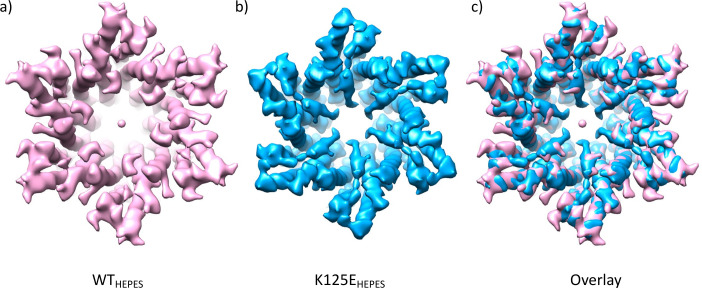
Figure 5—figure supplement 5. Comparison of density maps from wild-type (WT) and K125E connexin26 (Cx26) purified in HEPES buffer at pH 7.4.

Figure 5—figure supplement 5.

(a) WT Cx26 at 4.9 Å resolution sharpened with a B-factor of –100. (b) K125E sharpened with B-factor of –273 and low pass filtered to 5 Å. (c) Superposition of the two maps.
Figure 5—video 1. Morph showing the conformational difference between D6 refined reconstructions of K125E and K125R.
Download video file (359.4KB, mp4)
K125E is coloured blue and K125R orange. The position of TM2 is highlighted by an oval in one of the subunits.
Figure 5—video 2. Morph showing the conformational differences between D6 refined reconstructions of wild-type (WT) and K125E in HEPES buffer.
Download video file (321.8KB, mp4)
WT (pink) K125E (blue). The position of TM2 is highlighted by an oval in one of the subunits.