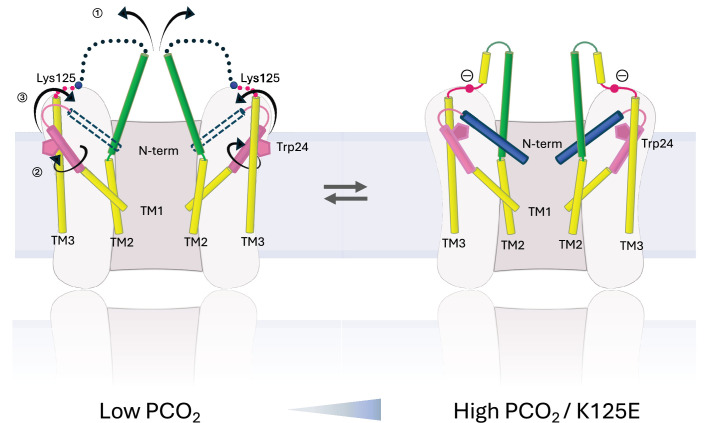
Figure 7. Schematic representation of conformational changes.
Schematic view of the cytoplasmic region of two opposing subunits within one hemichannel of the gap junction. The open structure on the left and the constricted structure on the right are in a dynamic equilibrium. Increase in partial pressure of CO2 (PCO2) and the introduction of a negative charge on Lys125 of the KVRIEG motif (magenta) pushes the equilibrium to the right. In going from one conformation to the other: ① the cytoplasmic region of TM2 (green) flexes around Phe83 and the cytoplasmic loop adopts a more defined conformation; ② the cytoplasmic region of TM1 (pink) rotates, illustrated here by the movement of Trp24; ③ the N-terminal helix (blue), which will be affected by both ① and ②, adopts a position within the pore that constricts the entrance to the channel.

