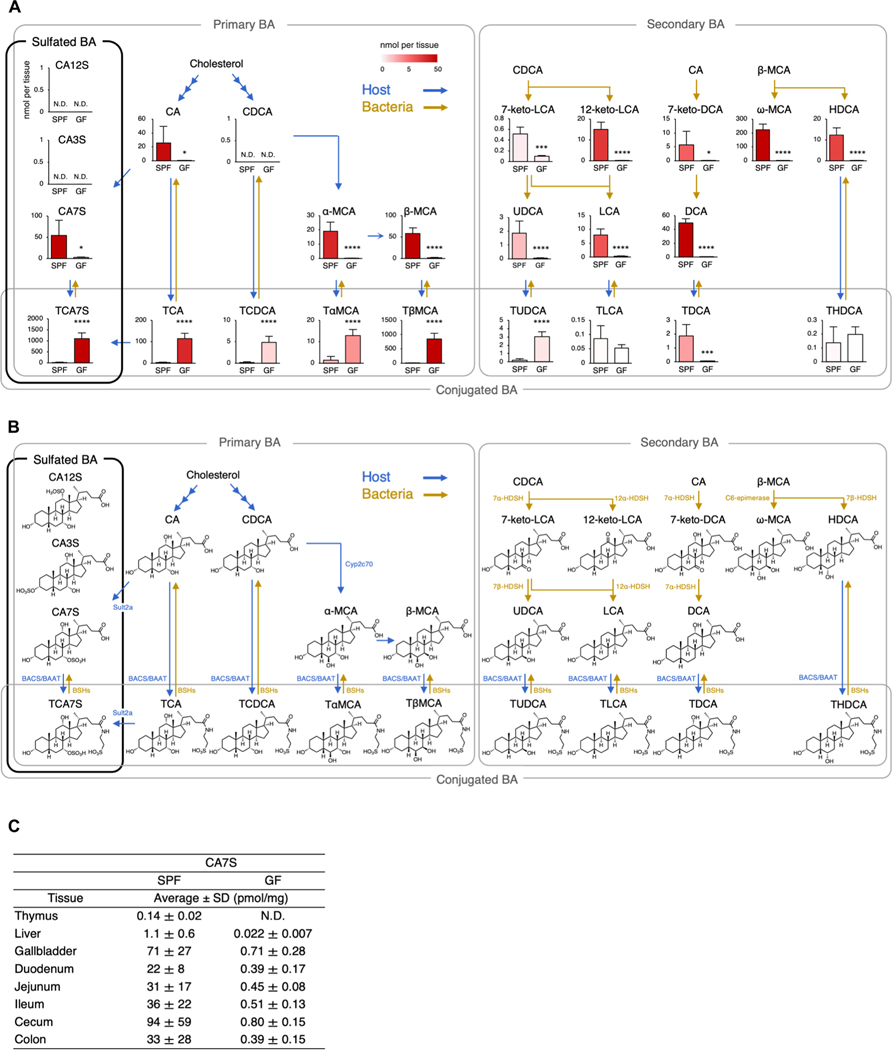
Fig. 2. Decrease in the level of CA7S in GF mice.
(A) Quantification of bile acid metabolites in the cecum and cecal contents from SPF and GF mice. Blue and yellow arrows indicate host- and bacteria-mediated enzymatic responses, respectively. N.D., not detected (<0.010 nmol per tissue). (B) Metabolic pathway map of bile acids in mice, related to (A). Sult, sulfotransferase; HDSH, hydroxysteroid dehydrogenase; BAAT, bile acid–CoA:amino acid N-acyltransferase; BACS, bile acid–CoA synthetase; Cyp, cytochrome P450; BSHs, bile salt hydrolases. (C) Tissue distribution of CA7S in various tissues of SPF and GF mice. N.D., not detected (<0.010 pmol/mg). (A and C) Data are presented as the means ± SD from experiments with three or more mice per group and are representative of two independent experiments. *P < 0.05, ***P < 0.005, and ****P < 0.001 by two-tailed, unpaired Student’s t tests with Benjamini-Hochberg correction.

