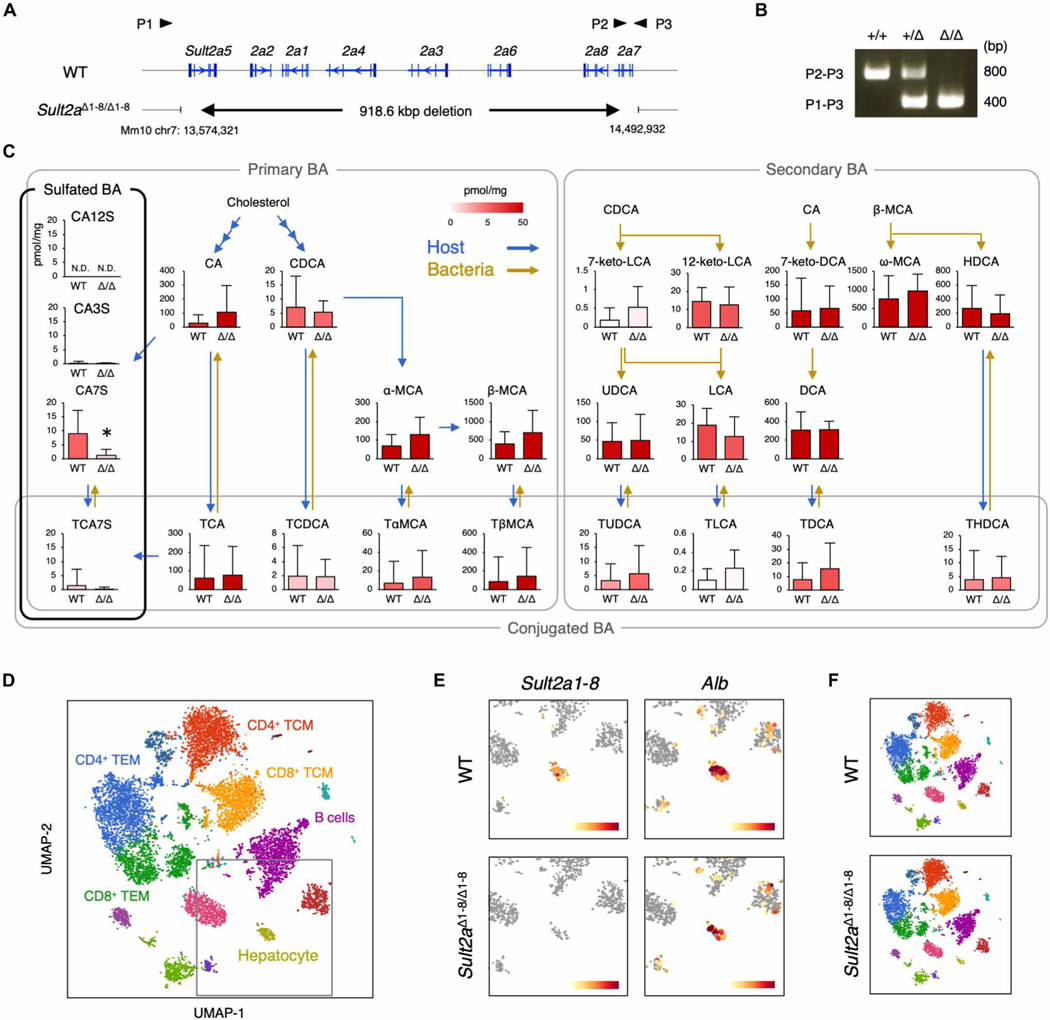
Fig. 5. Generation of Sult2aΔ1–8/Δ1–8 mice.
(A) Gene-targeting strategy for Sult2aΔ1–8/Δ1–8 mice. P1, P2, and P3 indicate primers used for genomic PCR. (B) Genotyping PCR of Sult2a+/+, Sult2a+/Δ1–8, and Sult2aΔ1–8/Δ1–8 mice. (C) Quantification of bile acid metabolites in feces from WT and Sult2aΔ1–8/Δ1–8 mice. Blue and yellow arrows indicate host- and bacteria-mediated enzymatic responses, respectively. (D) UMAP projection based on sc-RNA-seq of density-fractionated liver cell suspensions from WT and Sult2aΔ1–8/Δ1–8 mice. Erythrocytes expressing Hbb-bs above 1.8 were excluded in the process of analysis. (E) Expression of Sult2a1–8 (left) and Alb (right) in the hepatocyte clusters derived from WT (top) and Sult2aΔ1–8/Δ1–8 (bottom) mice. (F) UMAP projection of WT (top) and Sult2aΔ1–8/Δ1–8 (bottom) mice. (C) Data are presented as the means ± SD from experiment with six or more mice per group. (D to F) Data are from experiments with three mice per group. (C) A direct product of SULT2A, CA7S, was analyzed by two-tailed, unpaired Student’s t tests (*P < 0.05). For all other bile acid metabolites, P values were adjusted with Benjamini-Hochberg correction (FDR < 0.05).

