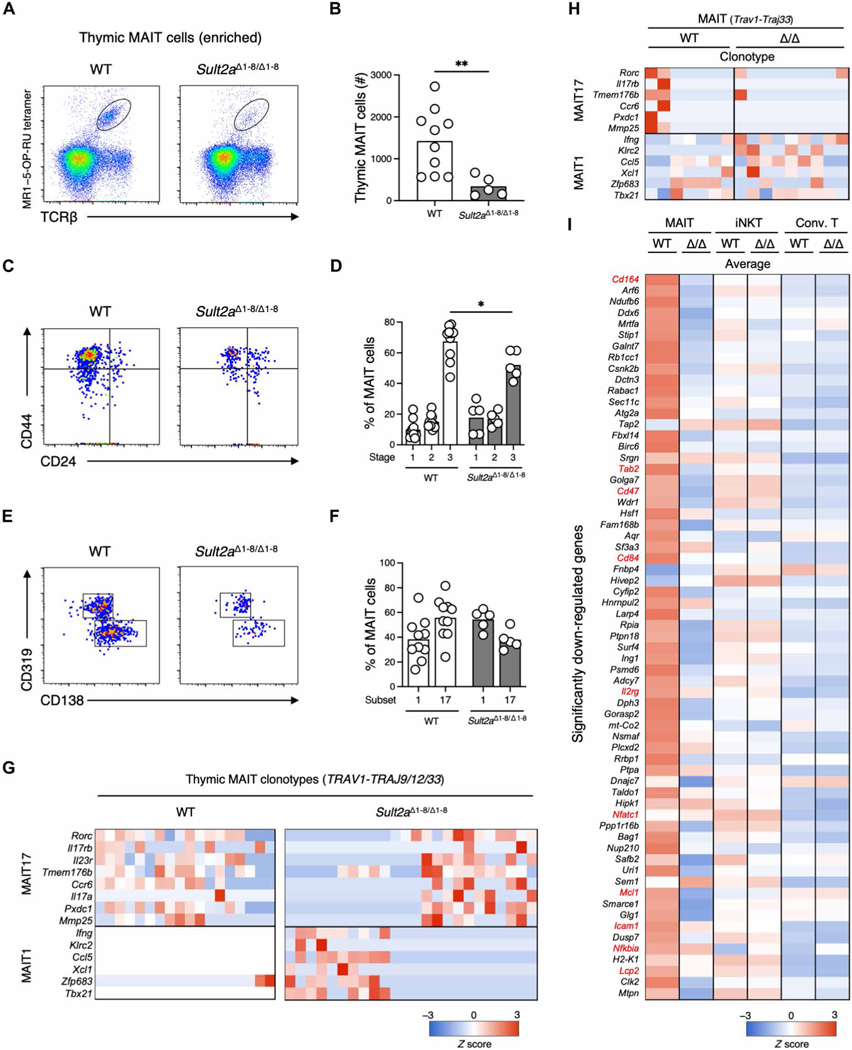
Fig. 6. Impaired MAIT cell development in Sult2aΔ1–8/Δ1–8 mice.
(A to F) Flow cytometry analysis of MAIT cells among MR1–5-OP-RU tetramer-enriched thymocytes from 3- to 4-week-old WT and Sult2aΔ1–8/Δ1–8 mice. (A) Representative flow cytometry dot plots of MR1–5-OP-RU tet+TCRβ+ MAIT cells in thymocytes. (B) Absolute number of thymic MAIT cells in WT and Sult2aΔ1–8/Δ1–8 mice. (C) Representative CD44 and CD24 expression in MAIT cells from WT (left) and Sult2aΔ1–8/Δ1–8 (right) mice. (D) Frequency of stage 1 (CD44−CD24+), stage 2 (CD44−CD24−), and stage 3 (CD44+CD24−) MAIT cells in WT and Sult2aΔ1–8/Δ1–8 mice. (E) Representative CD319 and CD138 expression in CD44+CD24− MAIT cells in WT (left) and Sult2aΔ1–8/Δ1–8 (right) mice. (F) Frequency of MAIT17 cells (CD138+) and MAIT1 cells (CD319+) in WT and Sult2aΔ1–8/Δ1–8 mice. (G and H) Heatmap of mRNA expression of MAIT1 and 17 signature genes in canonical MAIT cells (Trav1-Traj9/12/33) in the (G) thymi and (H) livers of WT and Sult2aΔ1–8/Δ1–8 mice. (I) Heatmap of mRNA expression in canonical MAIT cells (Trav1-Traj9/12/33), canonical iNKT cells (Trav11-Traj18), and conventional T cells in the liver of WT and Sult2aΔ1–8/Δ1–8 mice. The genes significantly down-regulated in Trav1-expressing cells from Sult2aΔ1–8/Δ1–8 mice (P < 0.05) compared with those from WT mice are shown. The gene expression levels are shown as average values. Data are from experiments with three or more mice per group. *P < 0.05 and **P < 0.01 by two-tailed, unpaired Student’s t tests or one-way ANOVA followed by Tukey’s multiple comparison test.

