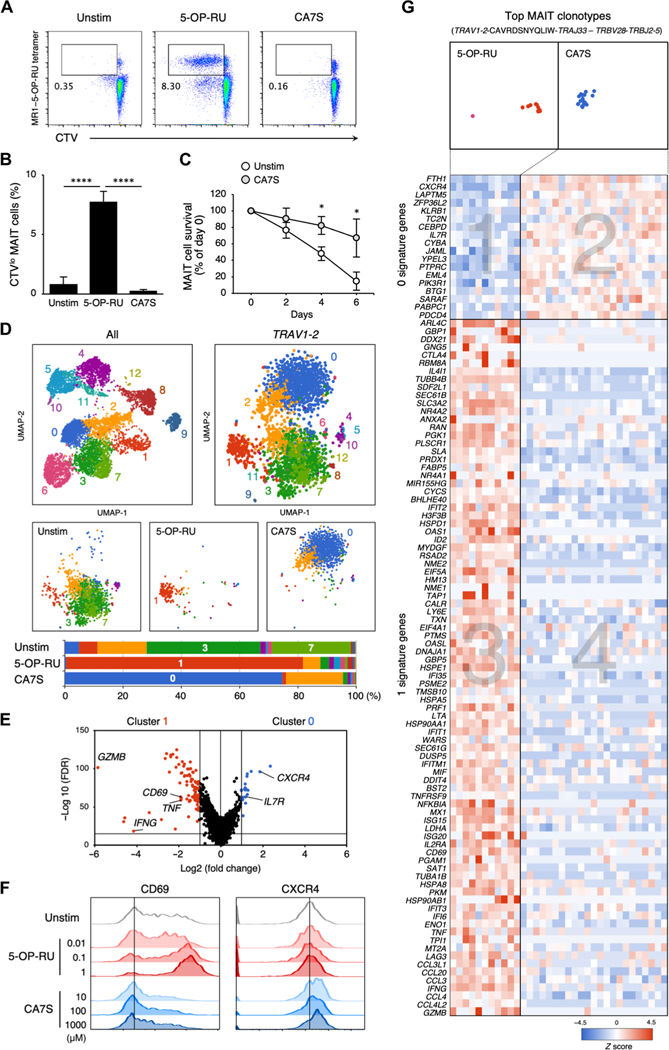
Fig. 7. Responses of human MAIT cell to CA7S.
(A and B) Human PBMCs were labeled with CTV and stimulated with vehicle control (Unstim), 5-OP-RU (10 μM), or CA7S (1000 μM) in the absence of cytokines on day 6. Representative flow cytometry dot plots of proliferating CD3+MR1–5-OP-RU tet+CTVlo MAIT cells (A). Proportion of MR1–5-OP-RU tet+CTVlo MAIT cells in CD3+-gated cells (B). (C) Survival ratio of MAIT cells stimulated with 1000 μM CA7S (CA7S) or left unstimulated (Un-stim). (D and E) Sc-RNA-seq of CD3+CD161+MR1–5-OP-RU tet+ MAIT cells stimulated with vehicle control (Unstim), 5-OP-RU (10 μM), or CA7S (1000 μM) for 24 hours. UMAP based on mRNA expression was performed on all isolated cells (top left). UMAPs of Trav1–2+ cells (top right) were separately shown for different stimuli (Unstim, 5-OP-RU, and CA7S) (middle). Proportions of the clusters in Trav1–2+ cells of each group are shown as bar graphs (bottom) (D). Volcano plot of mRNA expression comparing the characteristic clusters of 5-OP-RU stimulation (cluster 1) and CA7S stimulation (cluster 0) (E). (F) Surface expression of CD69 and CXCR4 after CA7S stimulation. PBMCs were stimulated with indicated concentrations of 5-OP-RU (red) or CA7S (blue), and surface expression of CD69 and CXCR4 within CD3+CD161+MR1–5-OP-RU tet+ MAIT cells was determined at day 9. (G) Heatmap of mRNA expression in the most frequent MAIT clonotypes (TRAV1–2-CAVRDSNYQLIW-TRAJ33–TRBV28-TRBJ2–5). The genes with differential expression between clusters 1 and 0 in (E) are shown. (B and C) Data are presented as the means ± SD of triplicate assays, and (A), (B), (C), and (E) are representative of more than three independent experiments. *P < 0.05 and ****P < 0.001 by two-tailed, unpaired Student’s t tests with Benjamini-Hochberg correction or one-way ANOVA followed by Tukey’s multiple comparison test.

