
Figure 1. Association of cfDNA concentration early during treatment and residual cancer burden (RCB) after neoadjuvant chemotherapy.
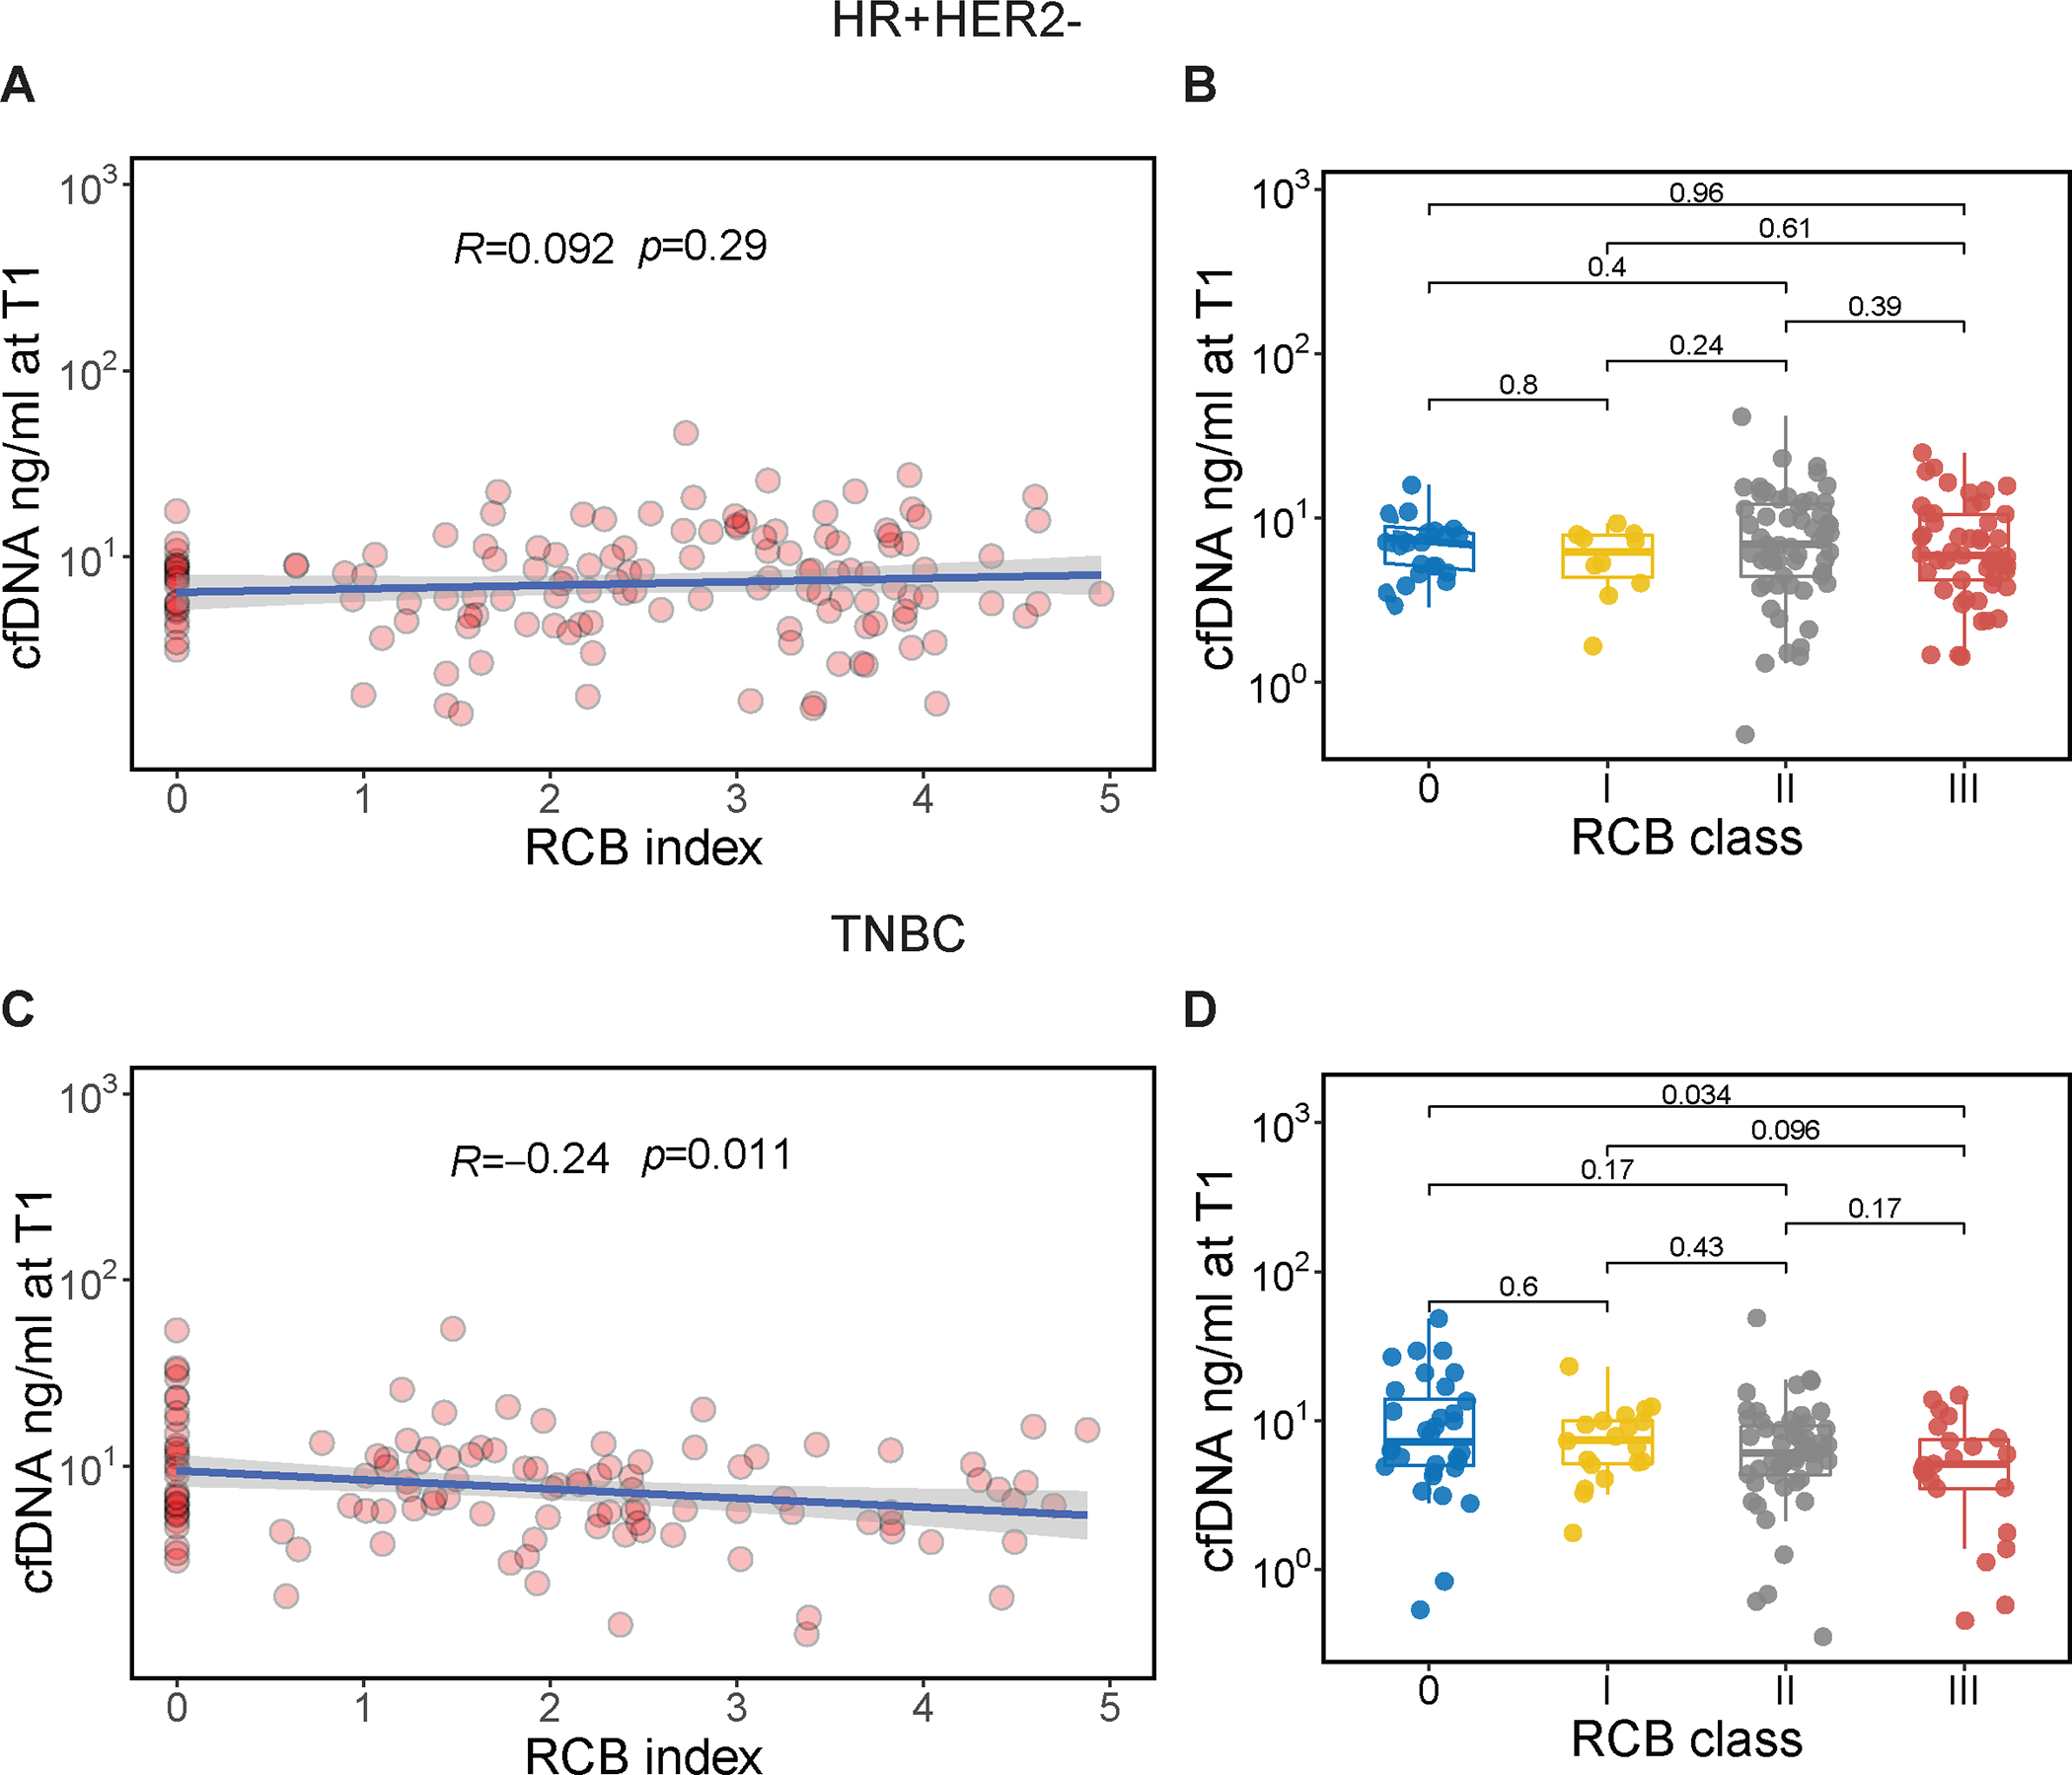
CfDNA concentration was measured in the plasma 3 weeks after treatment initiation (T1) in patients with hormone receptor-positive/HER2-negative (HR+HER2−, top panel) and triple-negative breast cancer (TNBC, lower panel); (A, C) Correlation of cfDNA concentration (ng/ mL, log10-transformed) at T1 and RCB index. The blue line and gray shading represent the regression line and the 95% confidence interval, respectively. Correlation coefficient and p values were calculated using Pearson’s correlation test; (C, D) Distribution of cfDNA concentration at T1 by RCB class. RCB was divided into 4 classes: RCB-0, equivalent to pathologic complete response, and −I, −II, −III, representing limited, moderate, and extensive residual cancer, respectively. For each box plot, the center line represents the median value (50th percentile), while the box contains the 25th to 75th percentiles of the data distribution. The whiskers represent the 5th and 95th percentiles, and the dots beyond the upper and lower bounds are considered outliers. Pairwise P values were calculated using the Wilcoxon rank sum test with Bonferroni correction to adjust for multiple comparisons.