
Figure 3. Clinical significance of cell-free DNA (cfDNA) vs. circulating tumor DNA (ctDNA) in hormone receptor-positive HER2-negative (HR+HER2−) and triple-negative breast cancer (TNBC).
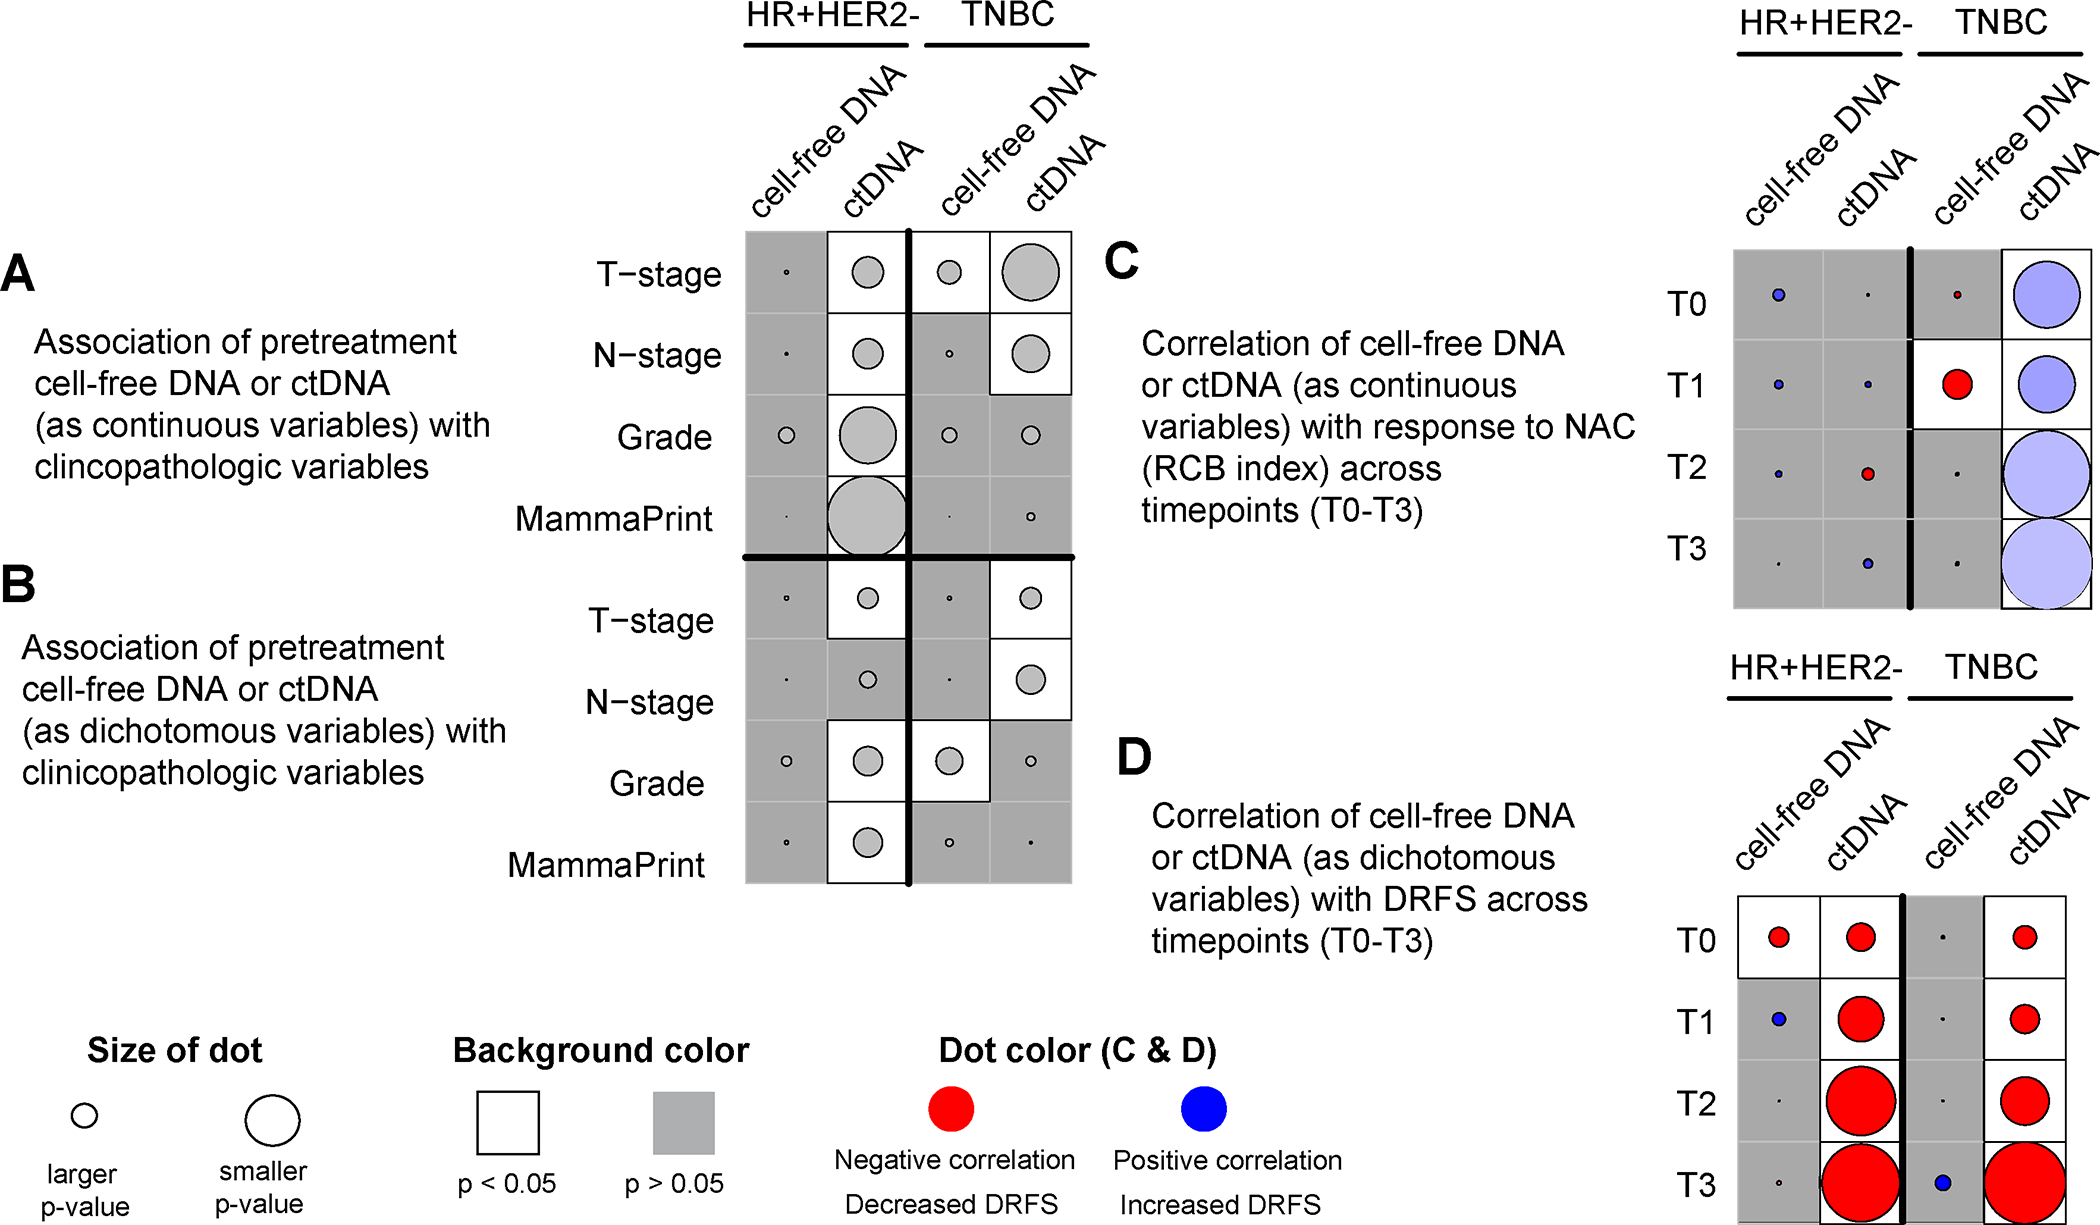
(A) Association of pretreatment (T0) cfDNA (see Supplementary Figure 3) and ctDNA concentration as continuous variables with clinicopathologic variables. The p values were calculated using the Wilcoxon rank-sum test; (B) Association of pretreatment (T0) cfDNA concentration (high vs. low cfDNA shedders using the median as the cutoff, see Table 1) and ctDNA (positive vs. negative) as dichotomous variables with clinicopathologic variables. The p values were calculated using Fisher’s exact test; (C) Correlation of cfDNA and ctDNA concentration (as continuous variables) at different timepoints (T0-T3) vs. residual cancer burden (RCB) index, the continuous measure of residual disease in the breast and regional lymph nodes after NAC. The p values were calculated using Pearson’s correlation test (see Figure 1 and Supplementary Figure 4). The color of the dot represents a negative (red) or positive (blue) correlation; (D) Correlation of cfDNA and ctDNA (as dichotomous variables) at different timepoints (T0-T3) vs. distant recurrence-free survival (DRFS) using Cox regression analysis. The p values were calculated using the Wald test (see Figure 2 and Supplementary Figure 6). The color of the dot represents decreased DRFS (red, hazard ratio>1) or increased DRFS (blue, hazard ratio <1). CfDNA and ctDNA were analyzed in the same plasma sample collected at pretreatment (T0), 3 weeks after treatment initiation (T1), 12 weeks after treatment initiation between paclitaxel-based treatment and anthracycline regimens (T2), and after neoadjuvant chemotherapy before surgery (T3).