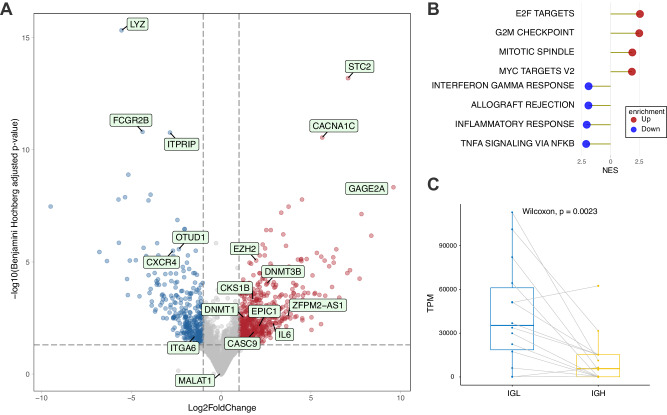
Fig. 4. Transcriptomic profile of EMM cells.
A Volcano plot showing the top three down- and upregulated genes, along with several other significantly deregulated genes between EMM (N = 14) and NDMM (N = 14) samples. B The top five up- and downregulated hallmark pathways detected by GSEA based on the aforementioned comparison. C Preferential expression of the immunoglobulin light chain (IGL) over the heavy chain (IGH) in EMM samples.

