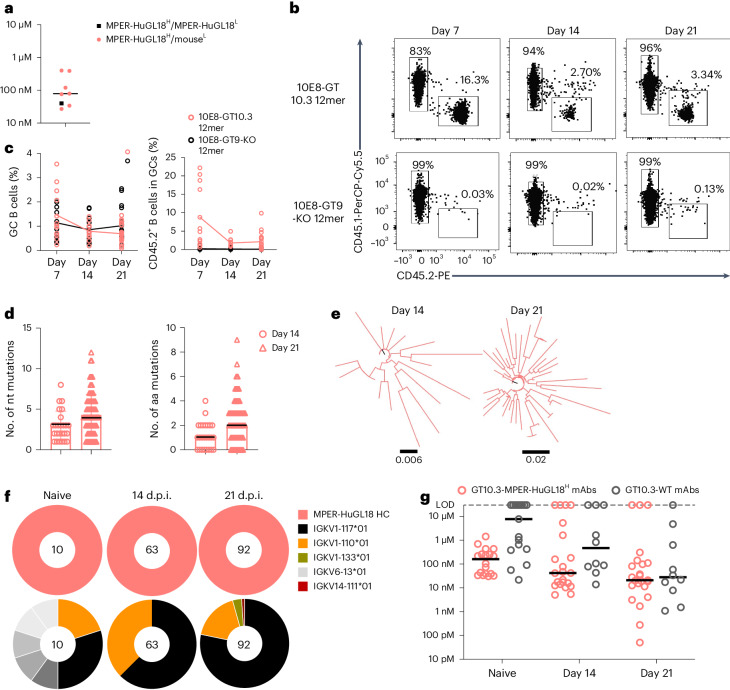
Fig. 7. MPER-HuGL18H mice show a sustained GC response to 10E8-GT10.3 12mer.
a, Affinities of human MPER-HuGL18H/MPER-HuGL18L Fabs and MPER-HuGL18H/mouseL Fabs to 10E8-GT10.3 12mer in the nanoparticle SPR assay. Symbols represent individual antibodies, and lines represent median MPER-HuGL18H/mouseL values. b,c, Representative flow cytometry plots showing CD45.2+ and CD45.1+ B cells (b) and quantification of the percentage of GC B cells and CD45.2+ B cells (c) in spleen GCs at days 7, 14 and 21 p.i. in CD45.1 wild-type mice transferred with CD45.2 MPER-HuGL18H B cells (1:104 MPER-HuGL18H B cells) 1 day before immunization with 5 µg of 10E8-GT10.3 12mer or 5 µg of 10E8-GT9-KO 12mer with alhydrogel. Data were pooled from two to three independent experiments (n = 4–10 per treatment), and lines show respective means. d, Number of nucleotide (nt; left) and amino acid (aa; right) mutations in IGHV of epitope-specific MPER-HuGL18H CD45.2+GT10++KO− GC B cells at days 14 and 21 p.i., as in b. The black line indicates the median number of mutations. e, Phylograms showing diversification of IGHV sequences from MPER-HuGL18 CD45.2+GT10++KO− GC B cells at days 14 and 21 p.i., as in d. f, Pie plots showing MPER-HuGL18 heavy chains (top) and associated mouse light chains (bottom) sequenced from epitope-specific MPER-HuGL18H CD45.2+GT10++KO− GC B cells at days 14 and 21 p.i. with 10E8-GT10.3 12mer and alhydrogel as in b and pretransfer (day −1, naive) MPER-HuGL18 GT10++KO− B cells as a control. g, Affinities of mAbs expressed from MPER-HuGL18H CD45.2+GT10++KO− GC B cells (GT10.3-MPER-HuGL18H) and endogenous CD45.1+GT10++KO− GC B cells (GT10.3-WT) at days 14 and 21 p.i. with 10E8-GT10.3 12mer as in b and affinities of iGL and pretransfer (day −1) MPER-HuGL18H, with iGL wild-type mAbs for monomeric 10E8-GT10.2 (naive) as a control, as measured by monomer SPR assay. Circles represent individual antibodies, and lines mark median values.

