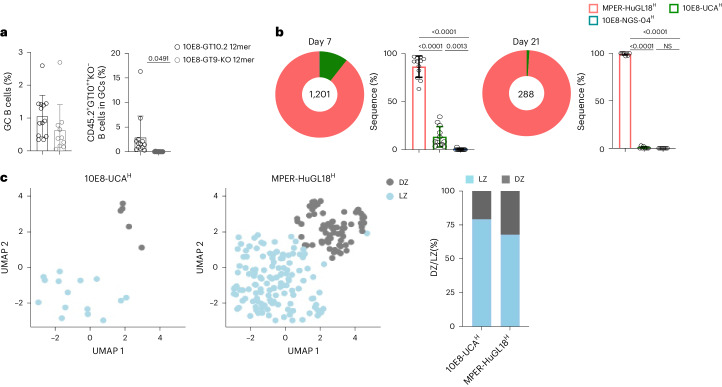
Fig. 8. Survival of 10E8 B cells in GCs after immunization with a clinically relevant candidate immunogen varies by precursor clonotype.
a, Quantifications of the percentages of GC B cells (left) and epitope-specific CD45.2+GT10++KO− GC B cells (right) in spleens at day 7 p.i. in CD45.1 wild-type mice adoptively transferred with 10E8-NGS-04H, 10E8-UCAH and MPER-HuGL18H CD45.2 B cells to reach a frequency of 1:104 for each precursor lineage 1 day before immunization with 5 µg of 10E8-GT10.2 12mer or 10E8-GT9-KO 12mer with alhydrogel. Data are pooled from two independent experiments (n = 5–7 per treatment). Error bars indicate mean ± s.d. from mice in the pooled group. Significance was calculated by using a two-tailed unpaired t-test. b, Pie plots and bar graphs showing the frequencies of MPER-HuGL18, 10E8-UCA and 10E8-NGS-04 heavy chains sequenced from CD45.2+GT10++KO− GC B cells at days 7 and 21 p.i. as in a (n = 12 mice). Significance was calculated by using an unpaired t-test with Welch’s correction. c, Uniform manifold approximation and projection embedding of 10E8-UCAH and MPER-HuGL18H CD45.2+GT10++KO− GC B cells from the dark zone (DZ) and light zone (LZ) of spleen GCs at day 7 p.i., as in b (left), and stacked bar plot showing cluster composition of 10E8-UCAH and MPER-HuGL18H light zone and dark zone B cells. Bars represent the fraction of cells in dark zone/light zone clusters in each cell line.

