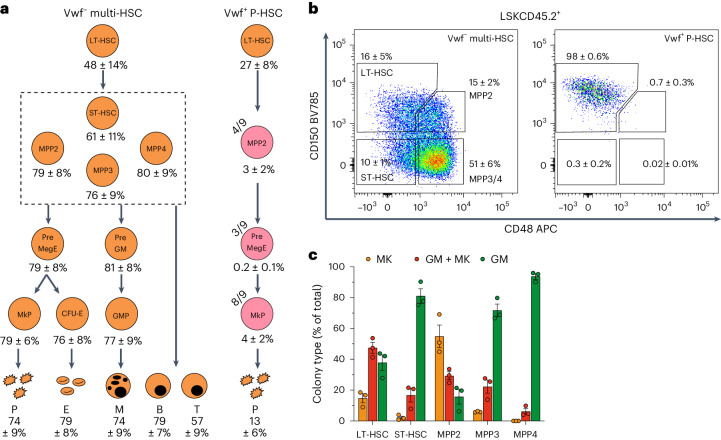
Fig. 1. Distinct platelet replenishment kinetics from single HSCs.
a, HSPC hierarchy reconstituted by single LSKGata1-eGFP−CD34−CD150+CD48− Vwf-tdTomato− multi-HSCs (n = 8) or Vwf-tdTomato+ P-HSCs (n = 9). The numbers shown are the mean ± s.e.m. percentage contributions to each population. Orange, reconstitution in all mice. Pink, reconstitution in some mice (the fraction of reconstituted mice is indicated in the upper left of each circle); mean of positive mice. Only progenitor populations present in ≥1/3 of mice and with ≥0.1% average reconstitution are shown. For the full P-HSC hierarchy, see Extended Data Fig. 1d. Phenotypic definitions: LT-HSC, LSKFLT3−CD150+CD48−CD45.2+; ST-HSC, LSKFLT3−CD150−CD48−CD45.2+; MPP2, LSKFLT3−CD150+CD48+CD45.2+; MPP3, LSKFLT3−CD150−CD48+CD45.2+; MPP4, LSKFLT3+CD45.2+; MkP, LKCD150+CD41+CD45.2+; preMegE progenitor, LKCD41−CD16/32−CD150+CD105−CD45.2+; colony-forming unit-erythroid (CFU-E), LKCD41−CD16/32−CD150−CD105+Gata1-eGFP+; pregranulocyte–monocyte (preGM) progenitor, LKCD41−CD16/32−CD150−CD105−CD45.2+; GMP, LKCD41−CD16/32+CD150−CD105−CD45.2+; platelets (P), CD150+CD41+TER119−Vwf-tdTomato+Gata1-eGFP+ for Vwf-tdTomatotg/+ Gata1-eGFPtg/+ donors; erythrocytes (E), TER119+CD150−CD41−Vwf-tdTomato−Gata1-eGFP+; myeloid (granulocyte and monocyte) cells (M), CD11b+NK1.1−CD19−CD4/CD8a−CD45.1−CD45.2+; donor-derived B lymphocytes (B), CD19+NK1.1−CD4/CD8a−CD11b−CD45.1−CD45.2+; donor-derived T lymphocytes (T), CD4/CD8a+NK1.1−CD11b−CD19−CD45.1−CD45.2+. b, HSCs and MPPs replenished by Vwf-tdTomato− multi-HSCs (n = 8) or Vwf-tdTomato+ P-HSCs (n = 9). Representative profiles and mean ± s.e.m. percentages of the parent LSKCD45.2+ gate are shown. c, Granulocyte/monocyte (GM) and megakaryocyte (MK) in vitro lineage potentials (mean ± s.e.m.) of HSCs and MPPs replenished by Vwf-tdTomato− multi-HSCs (n = 3). Data are from 580–720 plated wells per population with a similar distribution across three replicates. Each dot represents an independent experiment.

