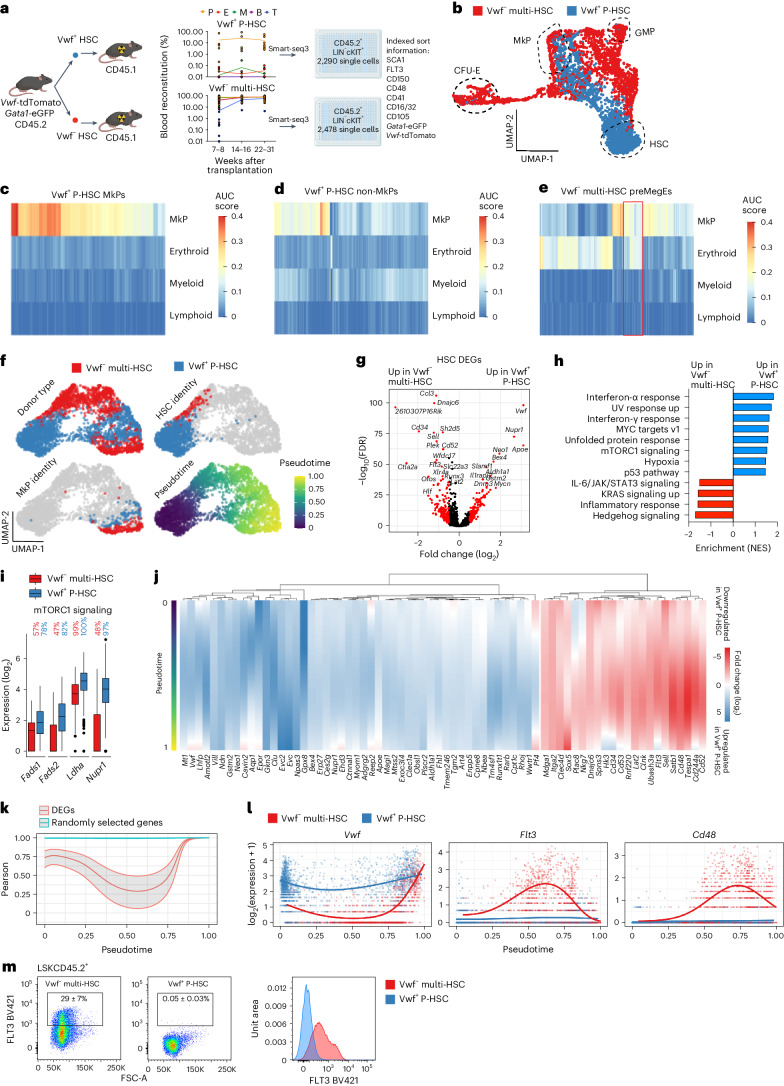
Fig. 3. Distinct molecular platelet differentiation pathways.
a, Left, experimental design (partly created with Biorender.com) for single-cell RNA sequencing of HSPCs generated by single Vwf-tdTomato+ P-HSCs (n = 7) or Vwf-tdTomato− multi-HSCs (n = 8). Right, mean (dots indicate individual mice) contribution to blood lineages. b, UMAP of LIN−cKIT+ cells replenished by single Vwf-tdTomato+ P-HSCs (blue; n = 7 mice, 2,290 cells) or Vwf-tdTomato− multi-HSCs (red; n = 8 mice, 2,478 cells). HSC, GMP, MkP and CFU-E cells were classified based on molecular signatures (Extended Data Fig. 3b). c–e, AUC heatmaps for lineage signatures in single MkPs (c; n = 133 cells) and other HSPCs (d; n = 2,157 cells) replenished by single Vwf-tdTomato+ P-HSCs (seven mice) and in preMegE progenitors with an MkP and/or erythroid AUC score of >0.1 (e; n = 212 cells) replenished by single Vwf-tdTomato– multi-HSCs (eight mice). Red rectangle, preMegE progenitors derived from Vwf-tdTomato– multi-HSCs with combined MkP–erythroid signatures without myeloid and lymphoid signatures. f, UMAP after removing erythroid- and myeloid-restricted progenitors, visualized by donor type, molecular HSC (MolO > 0.22), molecular MkP (AUC > 0.25) and pseudotime order. g, DEGs (red; adjusted P < 0.05, absolute log2(fold change) > 0.5) when comparing MolO HSCs replenished by Vwf-tdTomato+ P-HSCs (n = 1,047 cells) and Vwf-tdTomato− multi-HSCs (n = 97 cells). h, Gene-set enrichment normalized enrichment scores (NES; false discovery rate (FDR) q value < 0.1) of HALLMARK pathways based on DEGs detected in g. i, Expression (log2) of DEGs (adjusted P < 0.05, combined Wilcoxon/Fisher’s exact test) related to mTORC1 signaling when comparing MolO HSCs derived from Vwf-tdTomato+ P-HSCs (n = 1,047 cells, seven mice) and Vwf-tdTomato− multi-HSCs (97 cells, eight mice). Boxes, first and third quartiles; line, median; whiskers, ±1.5× interquartile range; dots, outlier cells. The percentages of cells with detected gene expression (Methods) are shown. j, Fold-change (log2) tradeSeq fitted expression values of the top 70 DEGs (adjusted P < 0.01, log2(fold change) > 1, patternTest tradeSeq function) along pseudotime when comparing cells replenished by Vwf-tdTomato+ P-HSCs and Vwf-tdTomato− multi-HSCs. k, Pearson correlation (center line) along pseudotime comparing the expression of the top 70 DEGs and 70 randomly selected non-DEGs between cells replenished by Vwf-tdTomato+ P-HSCs and Vwf-tdTomato− multi-HSCs. Shading indicates the 95% confidence interval (CI). l, Normalized gene expression along pseudotime for cells shown in f. Lines show the mean expression count from the generalized additive model fit using tradeSeq. m, FLT3 expression in LSKCD45.2+ cells generated by single Vwf-tdTomato− multi-HSCs (n = 8) and Vwf-tdTomato+ P-HSCs (n = 9). Representative profiles with mean ± s.e.m. percentages of parent gates and representative histograms are shown.

