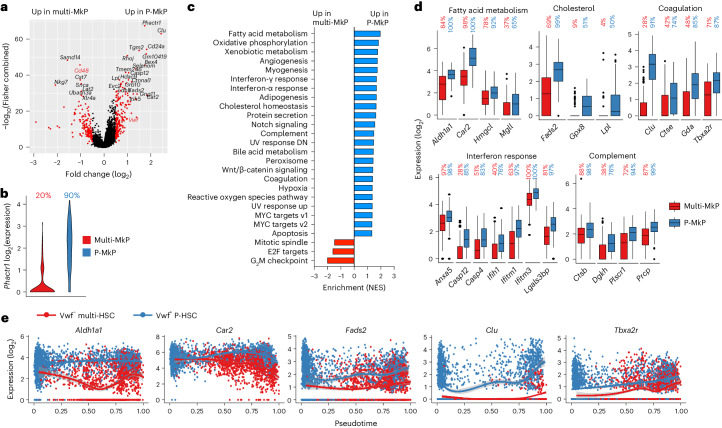
Fig. 4. Transcriptional characterization of MkPs replenished by single Vwf-tdTomato− multi-HSCs and Vwf-tdTomato+ P-HSCs.
a, DEGs (red; adjusted P < 0.05 and absolute log2(fold change) > 0.5, combined Wilcoxon/Fisher’s exact test) when comparing molecular MkPs replenished by single Vwf-tdTomato− multi-HSCs (multi-MkPs; n = 177) or Vwf-tdTomato+ P-HSCs (P-MkPs; n = 119). Cd48 and Vwf are highlighted in red. b, Expression (log2) of Phactr1, the top DEG (P < 0.05, log2(fold change) > 0.5, combined Wilcoxon/Fisher’s exact test) when comparing multi-MkPs and P-MkPs. The percentages of cells with detected expression (Methods) are indicated above the violin plots. c, Normalized gene-set enrichment score for HALLMARK pathways of DEGs enriched (FDR q value < 0.1) in multi-MkPs (red) and P-MkPs (blue). d, Expression (log2) of DEGs (adjusted P < 0.05, combined Wilcoxon/Fisher’s exact test) associated with fatty acid metabolism, cholesterol homeostasis, coagulation, interferon response and complement when comparing multi-MkPs (red; n = 177 cells, eight mice) and P-MkPs (blue; n = 119 cells, seven mice). Boxes, first and third quartiles; line, median; whiskers, the largest values within the ±1.5× interquartile range; dots, outliers. The percentages of cells with detected gene expression (Methods) are shown above the boxes. e, Expression (log2) of selected genes in all LIN−cKIT+ single cells generated by single Vwf-tdTomato− multi-HSCs or Vwf-tdTomato+ P-HSCs along pseudotime. Dots represent individual cells, and lines represent LOESS (locally estimated scatterplot smoothing) curves of the expression for the HSC subtype (gray shading indicates the 95% CI).

