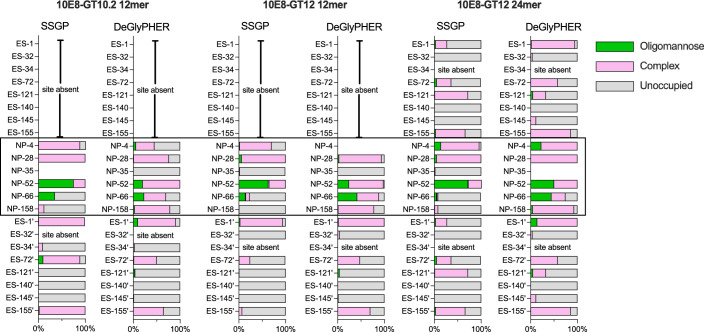
Extended Data Fig. 2. Glycosylation sites on 10E8-GT nanoparticles vary in occupancy.
Site-specific glycan analysis was measured using the single site glycan profiling (SSGP) and DeGlyPHER methods. Positions of N-linked glycosylation sites are indicated as relative positions within the epitope-scaffold (ES) or the nanoparticle (NP, indicated with a black box). The 24mer contains two independent copies of the scaffold, which cannot be distinguished by either method and therefore averaged values are shown.

