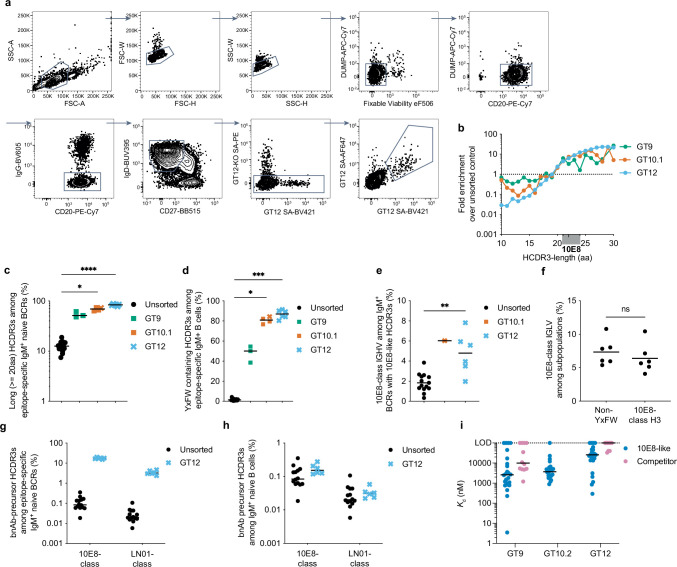
Extended Data Fig. 4. Ex vivo evaluation of 10E8-GT scaffolds, related to Fig. 4.
a, Representative gating scheme. b, Enrichment of HCDR3 lengths among epitope-specific B cells over unsorted controls as in Fig. 4d. c, Frequency of long (>=20aa) HCDR3s among epitope-specific B cells (sorted) as in b, or among total IgM+ naïve B cells (unsorted). Symbols represent n = 3 (GT9), n = 4 (GT10.1), n = 6 (GT12) or n = 14 (unsorted controls) independent donors. * p = 0.046, **** p < 0.0001, Kruskal-Wallis test with Dunn’s multiple comparison correction. d, Percentage of HCDR3s containing the YxFW motif among epitope-specific B cells as in c. * p = 0.03, *** p = 0.0001, Kruskal-Wallis test with Dunn’s multiple comparison correction. e, Percentage of 10E8-class VH among epitope-specific BCRs with 10E8-like HCDR3s (with length 21-24 aa and YxFW at correct position within HCDR3) within datasets obtained using the 10x Genomics sequencing method as in c. **p = 0.002, two-sided Mann-Whitney test. f, Percentage of IGVL3 family light chains among 10E8-GT12-sorted BCRs that are either 10E8-class (10E8-class H3) or lack the YxFW motif (non-YxFW). n = 6 independent donors, ns not significant, two-sided Wilcoxon test. g, Percentage of 10E8-GT12-specific naive IgM+ BCRs with 10E8-class or LN01-class HCDR3s. Symbols represent n = 6 (GT12) or n = 14 (unsorted controls) independent donors. h, Frequency of 10E8-class or LN01-class B cells among IgM+ naive B cells, detected through 10E8-GT12 sorting as in g. i, SPR-measured monovalent Kd values for 10E8-GT9, 10E8-GT10.2, and 10E8-GT12 monomer binding to 10E8-class and non-10E8-class (competitor) antibodies isolated by the respective scaffolds. Symbols represent different antibodies; lines represent median values.

