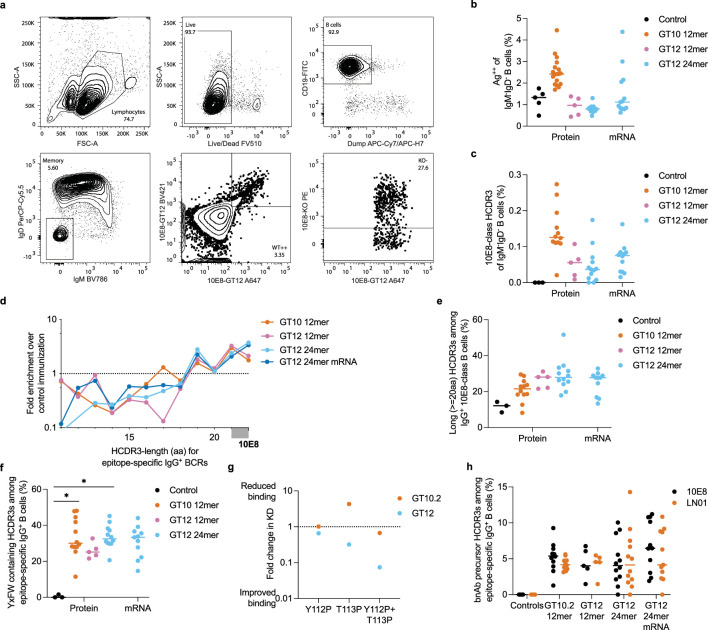
Extended Data Fig. 8. Immunogenicity of 10E8-GT nanoparticles in hD3-3/JH6 mice.
a, Representative gating strategy of splenic B cells sorted for sequencing of BCRs from hD3-3/JH6 mice six weeks after immunization with 10E8-GT12 24mer. b, Percentage of 10E8-GT-binding cells (10E8-GT9-KO++, 10E8-GT10.1++ or 10E8-GT12++−) among IgM−IgD− B cells, 42 days after immunization of hD3-3/JH6 mice with 10E8-GT9-KO 12mer (control, n = 3), 10E8-GT12 12mer (n = 12), 10E8-GT12 12mer (n = 5) or 10E8-GT12 24mer (n = 12) delivered as protein in SMNP, respectively, or 10E8-GT12 24mer delivered by mRNA (n = 11). Each symbol indicates an animal, lines indicate median values. c, Percentage of 10E8-class HCDR3s among all IgM−IgD− B cells after immunization as in b. d, Enrichment ratio for HCDR3 amino acid (aa) length distribution for epitope-specific (10E8-GT10.1++10E8-GT10.1-KO− or 10E8-GT12++10E8-GT12-KO−) IgG+ B cells from animals immunized with the indicated 10E8-GT immunogens, relative to HCDR3 amino acid length distribution for epitope-specific (10E8-GT9−KO++10E8-GT9−) IgG+ B cells from animals immunized with 10E8-GT9-KO 12mer as in b. HCDR3 lengths longer than 22 were only found in the 10E8-GT-immunized groups, precluding calculation of enrichment scores for longer HCDR3s. e, Frequency of long (>=20 aa) HCDR3s among epitope-specific IgG+ B cells as in d. f, Percentage of HCDR3s containing the YxFW motif among epitope-specific IgG+ B cells as in c. *p < 0.05, Kruskal-Wallis test with Dunn’s multiple comparison correction. P value (control vs. GT10 12mer): 0.02, p value (control vs. GT12 24mer): 0.01. g, Fold-change in SPR-measured KD for 10E8-GT immunogens binding to 10E8-iGL3 upon addition of the indicated HCDR3 mutations. h, Percentage of epitope-specific (10E8-GT9-KO++10E8-GT9−,10E8-GT10.1++10E8-GT10.1-KO−, or 10E8-GT12++10E8-GT12-KO−) with 10E8−class or LN01-class HCDR3s among IgG+ BCRs from day 42 after immunization of hD3−3/JH6 as in b. Symbols represent individual animals; bars indicate median values.

